. 2019 Sep 9;50(5):545-556.e4.
doi: 10.1016/j.devcel.2019.07.008. Epub 2019 Aug 1.

Actin Dynamics Drive Microvillar Motility and Clustering during Brush Border Assembly

Affiliations

Actin Dynamics Drive Microvillar Motility and Clustering during Brush Border Assembly

Leslie M Meenderink et al. Dev Cell. .

Abstract

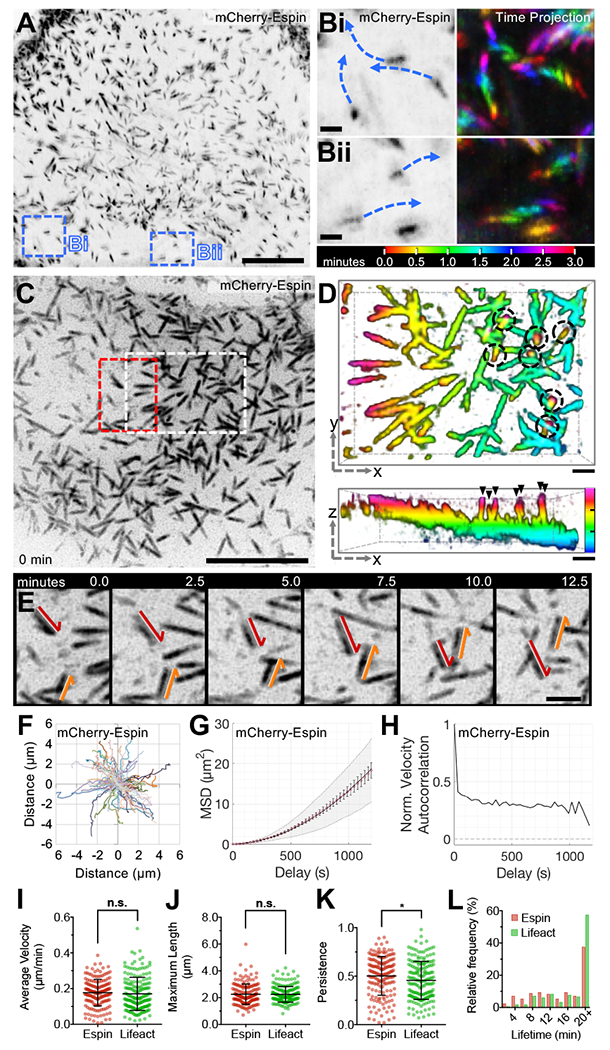
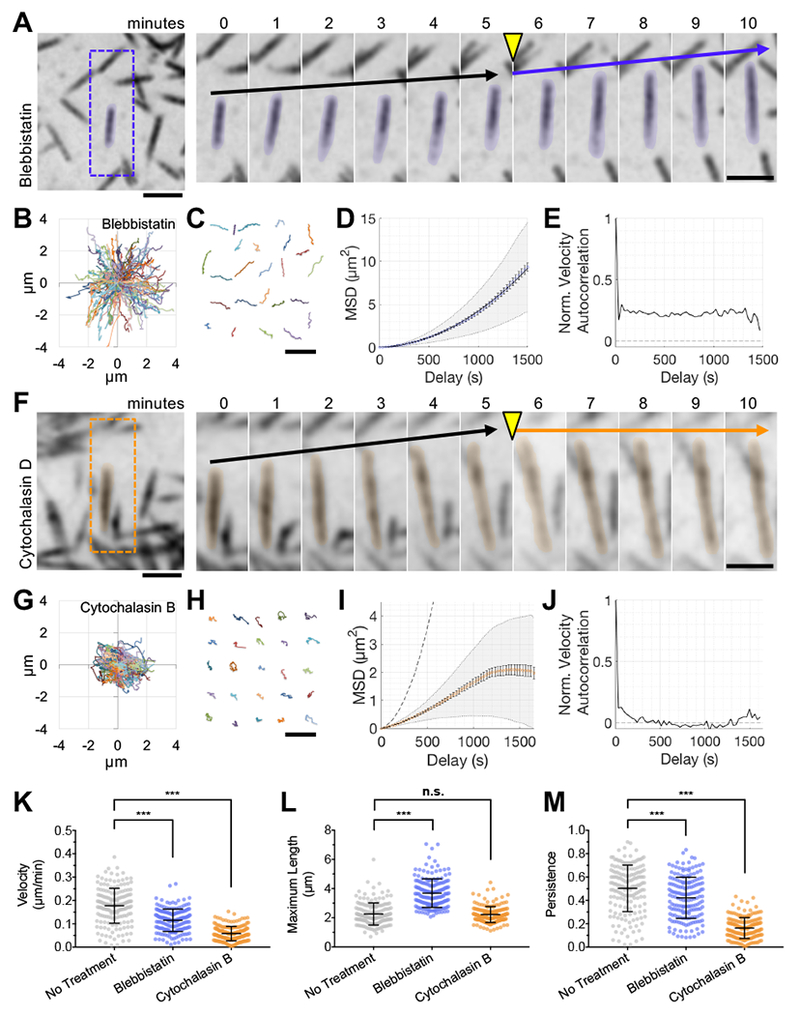
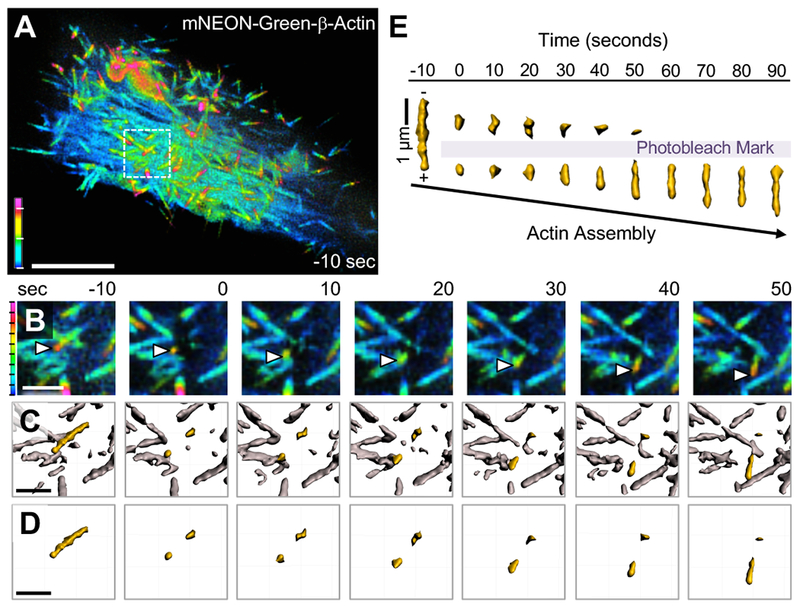
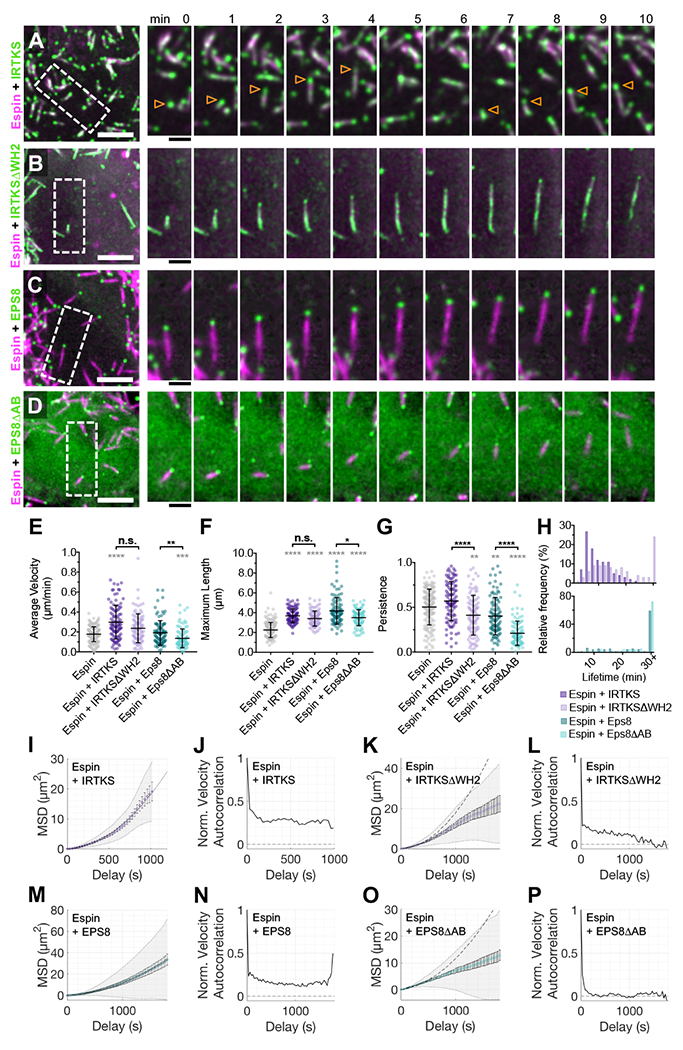
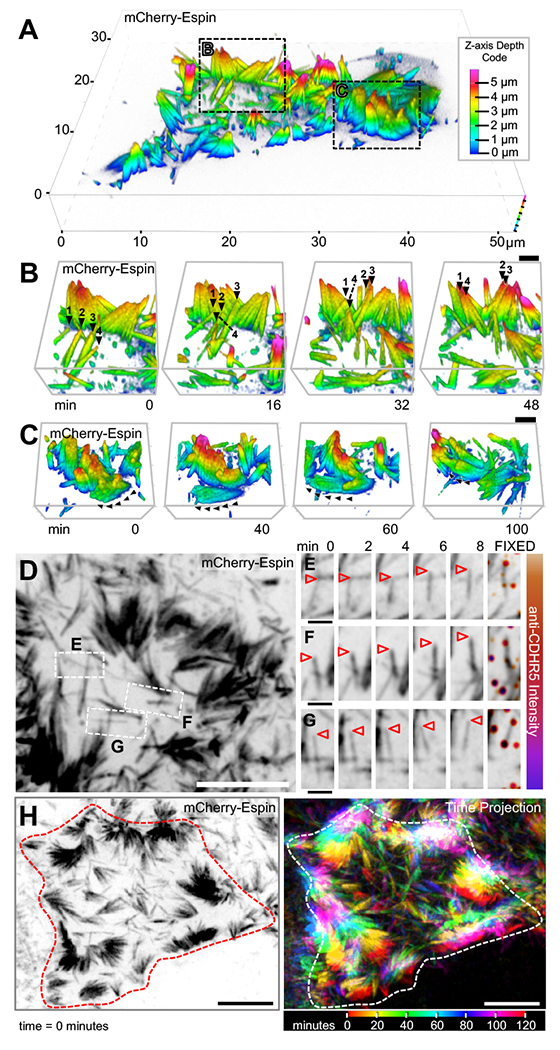
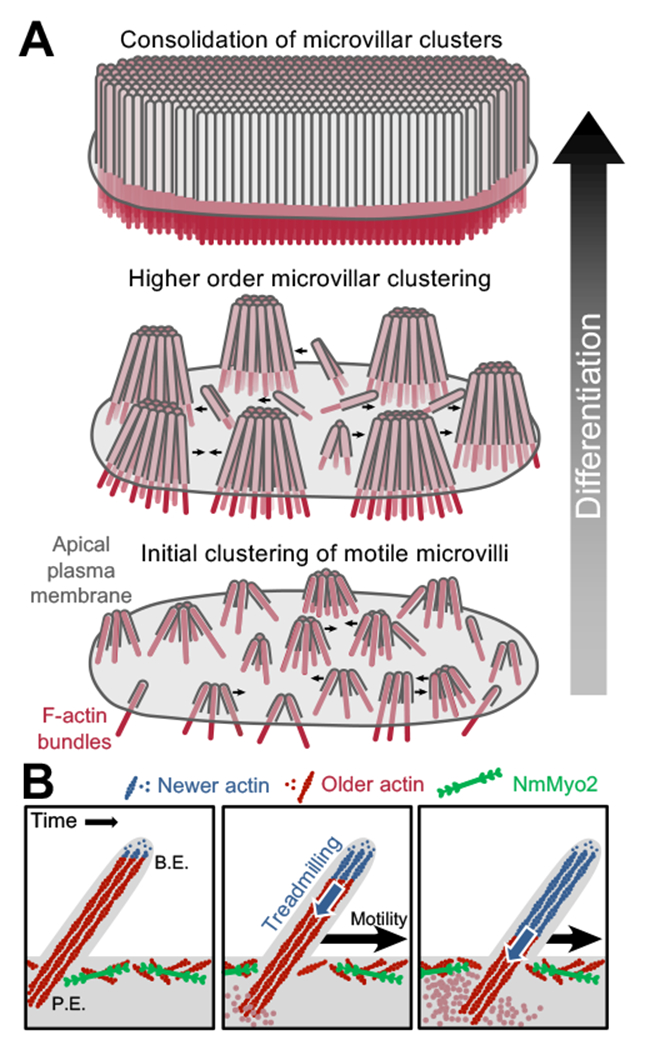
Transporting epithelial cells generate arrays of microvilli, known as a brush border, to enhance functional capacity. To understand brush border formation, we used live cell imaging to visualize apical remodeling early in this process. Strikingly, we found that individual microvilli exhibit persistent active motility, translocating across the cell surface at ∼0.2 μm/min. Perturbation with inhibitors and photokinetic experiments revealed that microvillar motility is driven by actin assembly at the barbed ends of core bundles, which in turn is linked to robust treadmilling of these structures. Actin regulatory factors IRTKS and EPS8 localize to the barbed ends of motile microvilli, where they control the kinetics and nature of movement. As the apical surface of differentiating epithelial cells is crowded with nascent microvilli, persistent motility promotes collisions between protrusions and ultimately clustering and consolidation into higher-order arrays. Thus, microvillar motility represents a previously unrecognized driving force for apical surface remodeling and maturation during epithelial differentiation.

Keywords: adhesion; bundle; epithelium; protocadherin; treadmilling.


Conflict of interest statement

DECLARATION OF INTERESTS

The authors declare no competing interests.

Figures

Figure 1.
Figure 1.. Microvilli exhibit persistent, active motility.
(A) LLSM of a CL4 cell stably expressing mCherry-Espin, reconstructed then viewed as a maximum intensity z-projection. Scale bar 10 μm, blue dashed boxes corresponds to B. (B) Enlarged images from A (left) with time projections (right) showing microvillar movement over 3 minutes. (C) SDCM of the apical surface of a CL4 cell stably expressing mCherry-Espin, viewed as a maximum intensity z-projection. Scale bar 10 μm, white dashed box corresponds to D, red dashed box corresponds to E. (D) 3-dimensional (3D) depth color coded z-stack viewed en face (xy plane, upper panel) or laterally (xz plane, lower panel). Scale bars are 1 μm, z-axis depth color code (lower panel) to scale with tick marks at 1 μm intervals. Microvilli exhibit a range of orientations from parallel (represented by a single color) to perpendicular to the cell surface (spanning multiple color bands, circled—top panel, arrowheads—bottom panel). (E) Time series of microvilli translocating across the cell surface; red and orange arrows highlight the paths of two distinct protrusions. Scale bar 2 μm. (F) Rose plot of trajectories measured from the tips of microvilli (n = 101) for the cell in C. (G) Microvillar trajectories from F were subject to MSD analysis; red open circles represent the mean MSD, error bars indicate standard error of the mean (SEM), grey area marks the weighted standard deviation (SD) over all MSD curves, and the solid line indicates a fit of the data to an active movement model (diffusion coefficient, D = 0.000283 μm2/s and velocity, V = 0.21 μm/min). (H) Trajectories from F were analyzed for normalized velocity autocorrelation, solid line. Dotted line at 0 indicates the velocity autocorrelation of random diffusive movement. (I-K) Average microvillar velocity, maximum microvillar length, and persistence, respectively. (L) Microvillar lifetime frequency histogram. Error bars indicate mean ± SD, (I-L) n = 171 microvilli from 7 cells for mCherry-Espin, n = 183 microvilli from 6 cells for EGFP-Lifeact, * p < 0.05, n.s. = not significant.
Figure 2.
Figure 2.. Microvillar motility is driven by actin assembly and is not dependent on myosin contractility.
(A) SDCM of the apical surface of CL4 cells stably expressing mCherry-Espin showing the response to 20 μM Blebbistatin. Right, time series montage of a single protrusion highlighted with a 10% pseudo-colored overlay. Scale bars are 2 μm. Drug was added following the 5-minute time interval, yellow arrowhead. Black arrows indicate the baseline rate of microvillar movement. Blue arrow indicates the rate of microvillar movement after the addition of drug. (B) Rose plot shows the microvillar trajectories (n = 100) from a single cell treated with 20 μM Blebbistatin. (C) 25 representative microvillar trajectories are isolated for display. Scale bar is 5 μm. (D) MSD analysis of microvillar trajectories from B. (E) Normalized velocity autocorrelation analysis of microvillar trajectories from B; data were fit to an active movement model with D = 0.000093 μm2/s, V = 0.12 μm/min. (F) SDCM of the apical surface of CL4 cells stably expressing mCherry-Espin showing the response to 30 μM Cytochalasin D. Right, time series montage of a single protrusion highlighted with a 10% pseudo-colored overlay. Scale bars are 2 μm. Drug was added following the 5-minute time interval, yellow arrowhead. Black arrows indicate the baseline rate of microvillar movement. Orange arrow indicates the rate of microvillar movement after the addition of drug. (G) Rose plot shows the microvillar trajectories (n = 100) from a single cell treated with 500 nM Cytochalasin B. (H) 25 representative microvillar trajectories are isolated for display. Scale bar is 5 μm. (I) MSD analysis of microvillar trajectories from G; data could not be fit with an active movement model. The curve for mCherry-Espin with no drug treatment is plotted for comparison (grey dotted line). (J) Normalized velocity autocorrelation analysis of microvillar trajectories from G. (K-M) Average microvillar velocity, maximum microvillar length, and persistence, respectively, measured from untreated cells (from Figure 1), or cells exposed to Blebbistatin or Cytochalasin B. For Blebbistatin and Cytochalasin datasets, n = 178 and 175 microvilli, respectively, from 6-7 cells. Bars represent mean ± SD. *** p < 0.0001, n.s. = not significant.
Figure 3.
Figure 3.. Microvillar F-actin cores undergo treadmilling during motility
(A) SDCM of a CL4 cell expressing mNEON-Green-β-actin viewed as a depth-coded z-projection. Scale bar is 10 μm, z-axis depth code with tick marks at 1 μm intervals is shown at lower left. (B) Time series montage of area in A highlighted by white dashed box, enlarged, cropped in z to remove cytoplasmic signal, then viewed as a depth-coded z-projection. Time series shows region of interest before photobleaching (−10 seconds), immediately after photobleaching (0 seconds), and during recovery. White arrowheads mark the growing distal tip of a microvillus. (C) Data from B were processed using Imaris to create a 3D surface of the fluorescent actin signal with the microvillus of interest highlighted in yellow. (D) Time series montage showing the isolated microvillus of interest before and after photobleaching. In B-D, scale bar is 2 μm, z-axis depth code (left) with tick marks at 200 nm intervals. (E) The microvillus of interest from D was viewed orthogonally over time and aligned based on the position of the bleached region to highlight treadmilling of the mark through the actin core. Shown here is a representative example of treadmilling observed from n > 20 cells.
Figure 4.
Figure 4.. Microvillar motility is regulated by barbed-end binding factors.
SDCM of the apical surface of CL4 cells stably expressing mCherry-Espin plus either EGFP-IRTKS (A), EGFP-IRTKSΔWH2 (B), EGFP-EPS8 (C), or EGFP-EPS8ΔAB (D). Scale bars are 5 μm. Right, time series montage of individual protrusions. Scale bars are 2 μm. Arrowheads in (A) indicate individual protrusions. (E-G) Average microvillar velocity, maximum microvillar length, and persistence, respectively. (H) Microvillar lifetime frequency histograms. Data for cells expressing mCherry-Espin alone (grey, from Figure 1) shown for comparison. Datasets for dual expression, n = 101 microvilli from 4 cells (Espin+IRTKS), 100 microvilli from 5 cells (Espin+IRTKSΔWH2), 101 microvilli from 5 cells (Espin+EPS8), and 100 microvilli from 7 cells (EPS8ΔAB). Bars represent mean ± SD. * p < 0.05, ** p < 0.01, *** p < 0.001, **** p < 0.0001, and n.s. = not significant. Grey asterisks (****) indicate significance compared to expression of mCherry-Espin alone (first column). The microvillar trajectories from E were analyzed for MSD (I, K, M, O) and velocity autocorrelation (J, L, N, P). Normalized velocity autocorrelation shown as a solid line. The dotted line at 0 indicates the velocity autocorrelation of random diffusive movement. MSD data showed a positive curvature and were fit to an active movement model and with D = 0.000276 μm2/s, V = 0.25 μm/min for (I) Espin+IRTKS and D = 0.000715 μm2/s, V = 0.18 μm/min for (M) Espin+EPS8. The curves for wildtype IRTKS (I) and EPS8 (M) are plotted for comparison (grey dotted line) on the graphs for their respective mutants (K and O).
Figure 5.
Figure 5.. Microvillar motility promotes intermicrovillar collisions, adhesion, and cluster formation.
(A) SDCM of the apical surface of a CL4 cell stably expressing mCherry-Espin at 2 DPC, visualized as a depth-coded composite. Image scale is shown on volume frame, depth scale is shown to the right. (B,C) Times series montages of areas highlighted in A, enlarged and rotated to optimize visualization of microvillar movement. In B, individual microvilli of interest are marked at each time point with numbered black arrowheads. In C, black arrowheads mark the path of motion for a cluster of microvilli. Scale bars are 2 μm. Z-axis depth code shown in A also applies to B and C. (D) SDCM of the apical surface of a CL4 cell stably expressing mCherry-Espin at 2 DPC, visualized as a maximum intensity z-projection. Image scale is 10 μm. (E-G) Time series montages of areas highlighted in D, enlarged and rotated to visualize microvillar movement, then fixed and stained for CDHR5 (far right panel). Tips of individual microvilli are marked with arrowheads. Image scales are 2 μm. (H) SDCM of the apical surface of a CL4 cell stably expressing mCherry-Espin at 2 DPC, visualized as a maximum intensity z-projection at time = 0 (left panel) and as a time projection over 120 minutes (right panel). Time scale at lower right. Image scale is 10 μm. Cell edge at time = 0 minutes outlined in red (left panel) or white (right panel).
Figure 6.
Figure 6.. A model for microvillar motility in brush border assembly.
(A) A progressive clustering model for microvillar remodeling and brush border formation during differentiation. Here, nascent microvilli emerge from the apical surface and undergo persistent motility, which promotes collisions between protrusions. These encounters allow adhesion links to form between microvillar tips, resulting in characteristic tepee-shaped structures (originally reported in Crawley et al. Cell 2014). As maturation proceeds, clusters grow by moving across the apical surface, colliding with other clusters and consolidating their numbers until eventually the entire surface is occupied by one continuous large-scale cluster, i.e. a mature brush border. (B) Enlarged view of a single motile microvillus. The microvillar core is comprised of bundled F-actin (red) with the barbed-ends oriented toward the distal tip. New actin monomers incorporate at the barbed-ends (B.E., blue F-actin), which is balanced by monomer disassembly from the pointed-ends (P.E.). This results in ‘treadmilling’ of actin through the microvillar core which provides a pushing force against the membrane that powers microvillar motility. NmMyo2 is localized at the sub-apical cortex and may interact with microvilli rootlets to provide a counterforce translating microvillus actin core treadmilling into movement across the cell surface.

Comment in

References

    1. Bartles JR, Zheng L, Li A, Wierda A, and Chen B (1998). Small espin: a third actin-bundling protein and potential forked protein ortholog in brush border microvilli. The Journal of cell biology 143, 107–119. - PMC - PubMed
    1. Bretscher A, and Weber K (1978). Localization of actin and microfilament-associated proteins in the microvilli and terminal web of the intestinal brush border by immunofluorescence microscopy. The Journal of cell biology 79, 839–845. - PMC - PubMed
    1. Bretscher A, and Weber K (1979). Villin: the major microfilament-associated protein of the intestinal microvillus. Proceedings of the National Academy of Sciences of the United States of America 76, 2321–2325. - PMC - PubMed
    1. Bretscher A, and Weber K (1980). Fimbrin, a new microfilament-associated protein present in microvilli and other cell surface structures. The Journal of cell biology 86, 335–340. - PMC - PubMed
    1. Casaletto JB, Saotome I, Curto M, and McClatchey AI (2011). Ezrin-mediated apical integrity is required for intestinal homeostasis. Proceedings of the National Academy of Sciences of the United States of America 108, 11924–11929. - PMC - PubMed

Publication types