. 2019 Sep 23;50(6):690-703.e6.
doi: 10.1016/j.devcel.2019.07.010. Epub 2019 Aug 1.

Cancer Cells Upregulate NRF2 Signaling to Adapt to Autophagy Inhibition

Affiliations

Cancer Cells Upregulate NRF2 Signaling to Adapt to Autophagy Inhibition

Christina G Towers et al. Dev Cell. .

Abstract

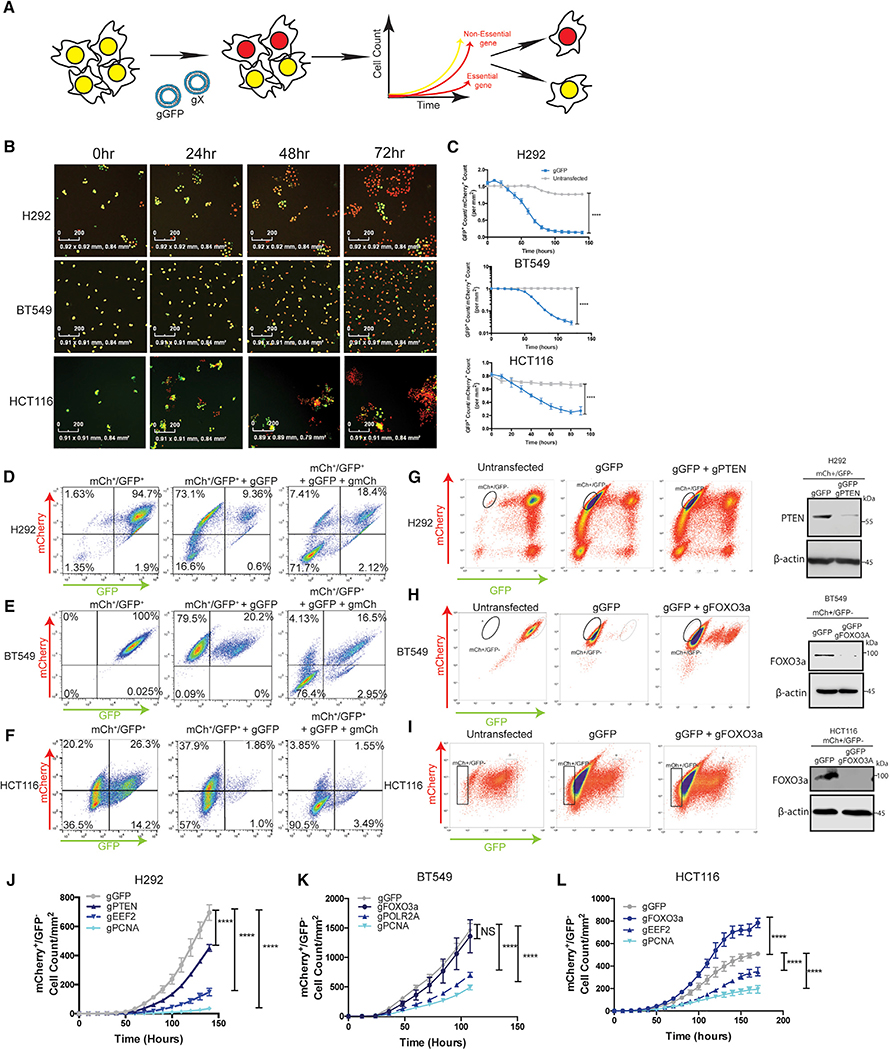
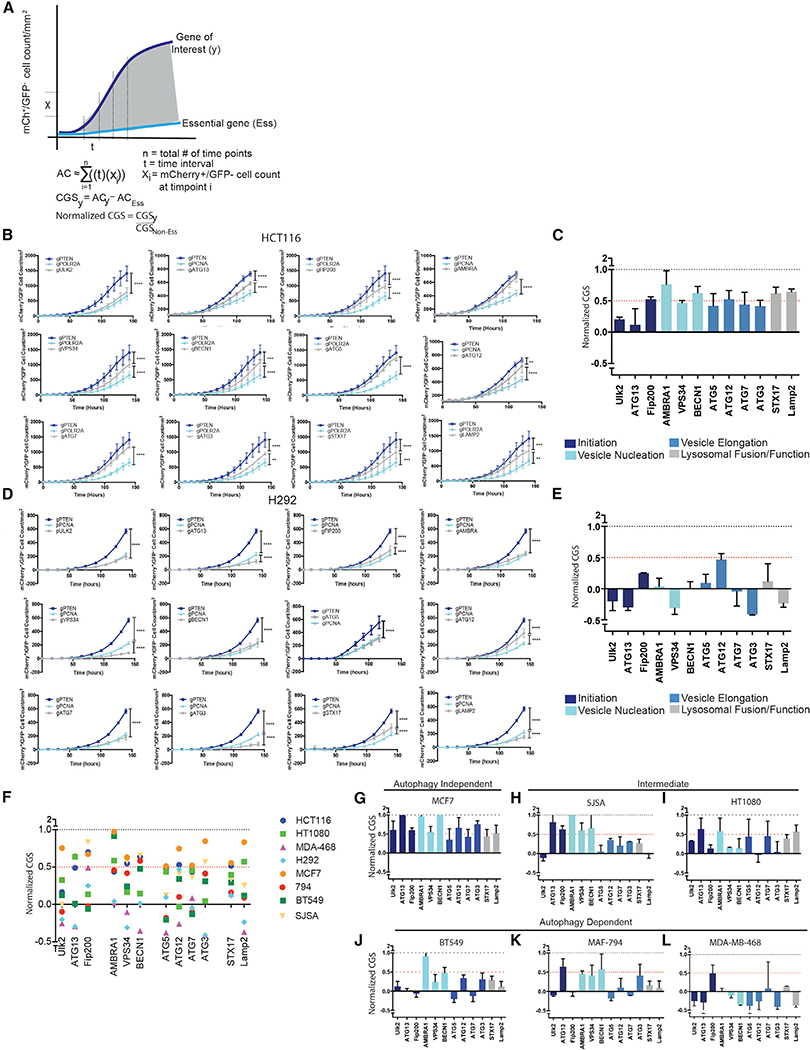
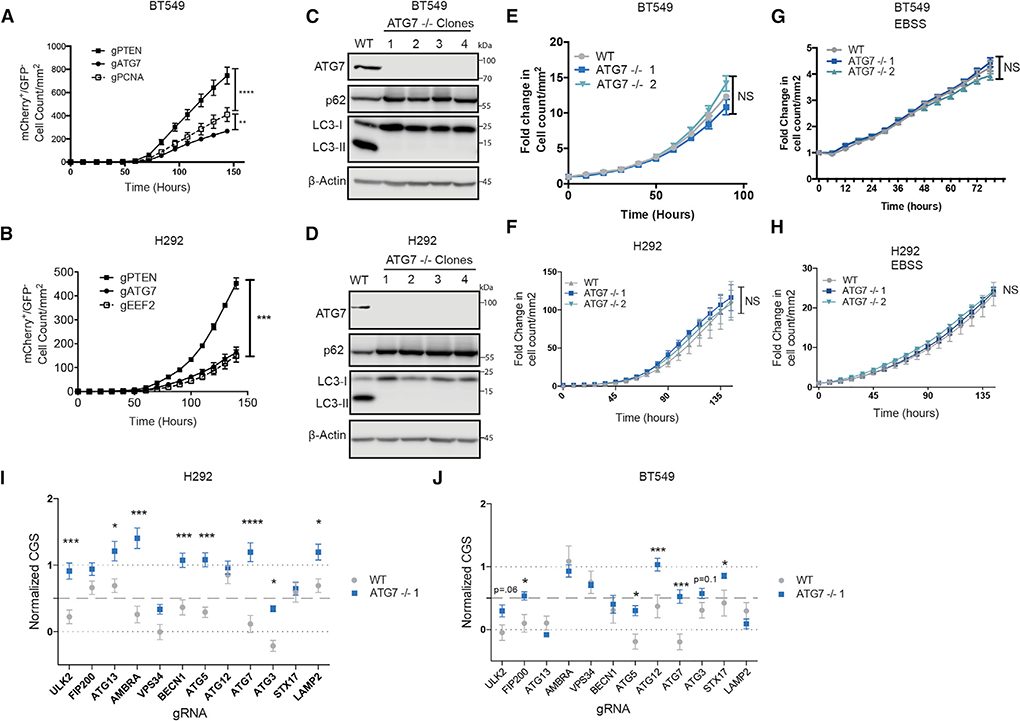
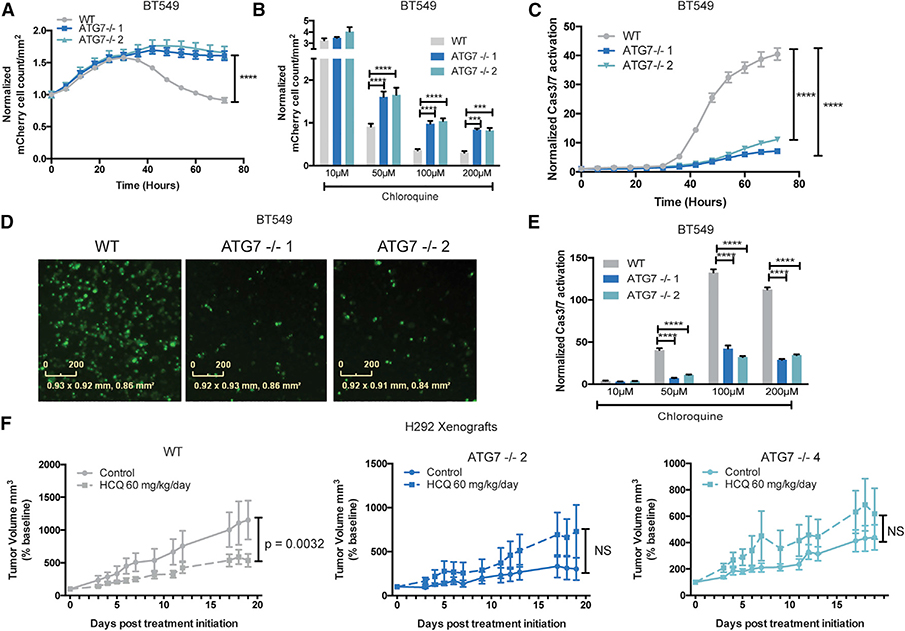
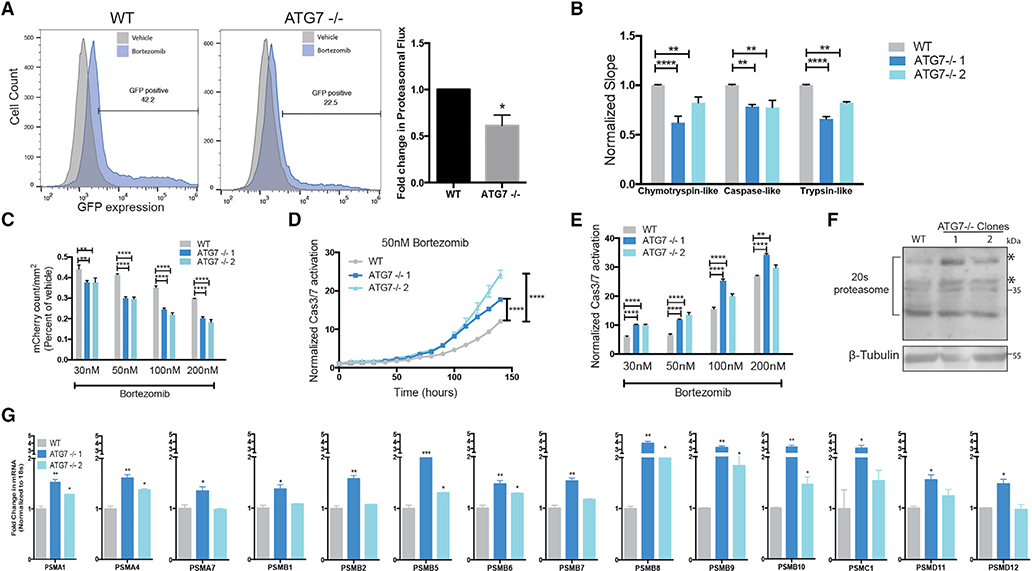
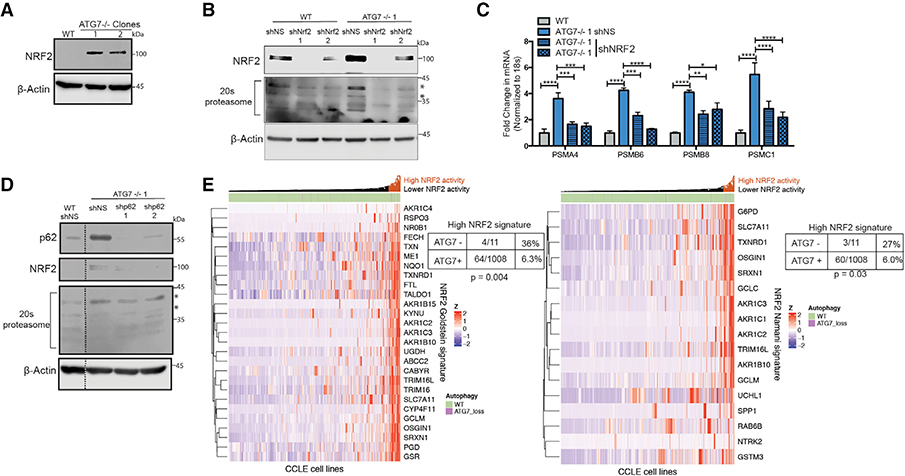
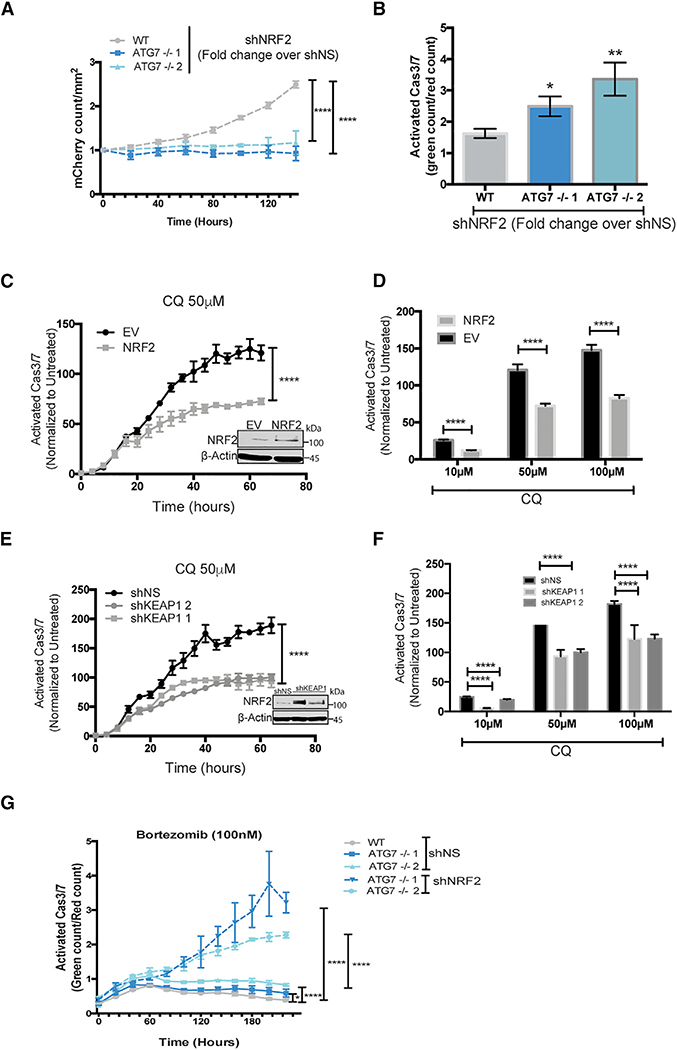
While autophagy is thought to be an essential process in some cancer cells, it is unknown if or how such cancer cells can circumvent autophagy inhibition. To address this, we developed a CRISPR/Cas9 assay with dynamic live-cell imaging to measure acute effects of knockout (KO) of autophagy genes compared to known essential and non-essential genes. In some cancer cells, autophagy is as essential for cancer cell growth as mRNA transcription or translation or DNA replication. However, even these highly autophagy-dependent cancer cells evolve to circumvent loss of autophagy by upregulating NRF2, which is necessary and sufficient for autophagy-dependent cells to circumvent ATG7 KO and maintain protein homeostasis. Importantly, however, this adaptation increases susceptibly to proteasome inhibitors. These studies identify a common mechanism of acquired resistance to autophagy inhibition and show that selection to avoid tumor cell dependency on autophagy creates new, potentially actionable cancer cell susceptibilities.

Keywords: ATG7; CRISPR/Cas9; NRF2; autophagy; cancer; chloroquine resistance; oxidative stress; proteasomal degradation.


Conflict of interest statement

DECLARATION OF INTERESTS

The authors declare no competing interests.

Figures

Figure 1.
Figure 1.. Design of a Quantitative Live-Cell Imaging CRISPR-RNP Assay to Identify Essential Genes
(A) Schematic representation of the assay. (B) Representative images and (C) Incucyte quantification of GFP+ cell count normalized to mCherry+ cell count in mCherry+/GFP+ H292, BT549, and HCT116 cells after transfection with gRNAs targeting GFP. Data are mean ± standard error of the mean (SEM) for technical replicates (N = 2–3) and graphs are representative of 3–6 individual experiments. Statistical analysis: two-way ANOVA and significance at the last time point is shown on the graph. Scale bars represent 200 mM. (D–F) Flow cytometry was performed in mCherry+/GFP+ cells before and after transfection with gGFP or gGFP+ gmCherry. Data are representative of 2–3 experiments. (G–I) Western blotting of the GFP sorted populations from mCherry+/GFP+ cells subject to RNP transfections with gRNAs targeting GFP and the indicated genes. (J–L) Incucyte quantification of mCherry+/GFP cell count/mm2 after transfection with RNPs targeting GFP and indicated genes, data are mean ± SEM for technical replicates (N of 2–3). The graphs are representative of 3–6 experiments. Statistical analysis: two-way ANOVA and the significance at the last time point is shown. *p % 0.05, **p % 0.01, ***p % 0.001, ****p % 0.0001. See also Figures S1 and S2.
Figure 2.
Figure 2.. Identification of Autophagy-Dependent and -Independent Cells
(A) Schematic depicting normalization to quantify gene essentiality. The area under the curve from the mCherry+/GFP growth curves for each gRNA was normalized to an essential and non-essential gene targeted for each cell line, such that the essential gene has a CGS of 0 and the non-essential gene has a CGS of 1. (B and D) Incucyte quantification of mCherry+/GFP cell count after transfection with gRNAs targeting GFP and the indicated genes. Data are represented as mean ± standard deviation (SD) for technical replicates (N = 2–3) and the graphs are representative of 2–3 individual experiments. Statistical analysis: two-way ANOVA and the significance at the last time point is shown. (C and E) The normalized CRISPR growth Score (CGS) was calculated for each autophagy-targeting gRNA based on the curves generated in (B or D) wherenormalized CGS for gPTEN is 1 and gPCNA/POLR2A is 0. Data are represented as mean ± SEM for experimental replicates (N = 2–3). (F) Comparison of normalized CGS for all the autophagy genes in the panel of cell lines. Each data point represents the mean of 2–4 experimental replicates. (G–L) The data graphed in (F) for each of the indicated cell lines. The data are represented as mean ± SEM for experimental replicates (N of 2–3). *p % 0.05, **p % 0.01, ***p % 0.001, **** p % 0.0001. See also Figures S3 and S4.
Figure 3.
Figure 3.. Autophagy-Dependent Cancer Cells Can Undergo Selection to Circumvent Inactivation of an Autophagy Regulator
(A and B) Incucyte quantification of mCherry+/GFP cell count after transfection with gRNAs targeting GFP and the indicated genes. Data are represented as mean ± SEM for technical replicates (N = 2–3). Graphs are representative of 2–3 individual experiments. Statistical analysis: two-way ANOVA. (C and D) Western blot analysis in clonal isolates of mCherry+/GFP cells weeks after treatment with gATG7. Data are representative of 2–3 experiments. (E–H) Incucyte quantification of mCherry+ cell count of WT or ATG7−/− clones in (E and F) nutrient replete conditions or (G and H) starved conditions in EBSS. Data are represented as mean ± SEM for technical replicates (N = 2–3) and graphs are representative of 2–3 individual experiments. Statistical analysis: two-way ANOVA. (I and J) Normalized CGS for WT or ATG7−/− clones calculated from Incucyte quantification of mCherry+/GFP cell count normalized to essential and non-essential genes after transfection with gRNAs targeting GFP and the indicated genes. Data are represented as mean ± SEM for technical replicates (N = 2–3) and graphs are representative of 2 individual experiments. Statistical analysis: two-way ANOVA. *p % 0.05, **p % 0.01, ***p % 0.001, **** p % 0.0001. Statistical significance indicated for the last time point for time course graphs. See also Figure S5.
Figure 4.
Figure 4.. Newly Acquired Autophagy Independence Causes Resistance to Pharmacological Autophagy Inhibition
(A) Incucyte mCherry+ cell count/mm2 in BT549 WT or ATG7−/− clones treated with CQ (50 mM ) normalized corresponding untreated wells. The data are represented as mean ± SEM for technical replicates (N = 3) and are representative of 4 individual experiments. Statistical analysis: two-way ANOVA. (B) The Incucyte mCherry+ cell count/mm2 72 h after treatment with the indicated dose of CQ in BT549 WT or ATG7−/− clones normalized to corresponding untreated samples. Data are represented as mean ± SEM for technical replicates (N = 3) and are representative of 3 individual experiments. Statistical analysis: two-way ANOVA. (C) Normalized Caspase3/7 CellEvent green count after treatment with CQ (50 mM) for BT549 WT and ATG7−/− clones. The data are represented as mean ± SEM for technical replicates (N = 3) and are representative of 2 individual experiments. Statistical analysis: two-way ANOVA. (D) Representative Incucyte images of Caspase 3/7 CellEvent green 48 h after treatment with 100 mM CQ in BT549 WT and ATG7−/− clones. The scale bars represent 0–200 mM. (E) Normalized Caspase3/7 CellEvent green count 72 h after treatment with CQ in BT549 WT and ATG7−/− clones. Data are represented as mean ± SEM for technical replicates (N = 3) and representative of 2 individual experiments. Statistical analysis: two-way ANOVA. (F) Mean tumor volume as a percentage of pre-treatment baseline, following initiation of vehicle or HCQ-treatment in mice bearing H292 WT or ATG7−/− xenograft tumors. N = 5–7 mice per group. Data are represented as mean ± SEM. Statistical analysis: two-way ANOVA. *p % 0.05, **p % 0.01, *** p % 0.001, ****p % 0.0001, statistical significance indicated for the last time point for time course graphs. See also Figure S5.
Figure 5.
Figure 5.. ATG7−/− Clones Have Defective Proteasomes and Acquire Increased Sensitivity to Proteasome Inhibition
BT549 WT and ATG7−/− clones (A) Left: Flow cytometry for GFP-ubiquitin expression after bortezomib treatment (50 nM, 24 h). Gated on 5% of the untreated cells and each sample shown is treated with bortezomib. Right: The data graphed represent the fold change (compared to WT) of bortezomib treated samples gated as GFP+ and are represented as the mean ± SEM for two individual experiments. Statistical analysis: two-tailed Student’s t test. (B) in vitro protease assay. Data represented as mean ± SEM for biological replicates (N = 2–3). Statistical analysis: two-way ANOVA. (C) Incucyte mCherry+ cell count/mm2 calculated 48 h after bortezomib treatment and normalized to TP0; fold change relative to vehicle is shown. Data represented as mean ± SEM for technical replicates (N = 3) and representative of 2 individual experiments. Statistical analysis: two-way ANOVA. (D and E) Normalized Caspase3/7 CellEvent green count after treatment with (D) Bortezomib (50 nM) or (E) 6 days after treatment with indicated doses of bortezomib. The data are represented as mean ± SEM for technical replicates (N = 3), representative of 2 individual experiments. Statistical analysis: two-way ANOVA. (F) Western blot analysis of BT549 WT and ATG7−/− clones, asterisks indicate the bands quantified in Figure S6E. (G) qRT-PCR to measure mRNA levels of 26S proteasome subunits relative to 18S mRNA levels. Data are represented as mean ± SD for technical replicates(N = 2) representative of 3 individual experiments. Statistical analysis: one-way ANOVA. *p % 0.05, **p % 0.01, ***p % 0.001, ****p % 0.0001, statistical significance indicated for the last time point for time course graphs See also Figure S6.
Figure 6.
Figure 6.. ATG7−/− Clones Upregulate NRF2
(A–D) BT549 WT and ATG7−/− clones. (A and B) Western blot analysis with shRNA-mediated KD of (B) NRF2; blots shown are representative of 2–5 experiments. Asterisks indicate the bands quantified in Figure S7D. (C) qRT-PCR to measure mRNA levels of 26S proteasome subunits relative to 18S mRNA levels after shRNA-mediated KD of NRF2. Data are represented asmean ± SD for technical replicates (N = 2) representative of 2 individual experiments. Statistical analysis: one-way ANOVA. (D) Western blot analysis after shRNA-mediated KD of p62. Dotted line indicates where unnecessary lanes were removed. Asterisks indicate the bands quantifiedin Figure S7E. (E) Hierarchical clustered RNA-seq data displaying ATG7 status in cell lines and NRF2 gene signature activation. Statistical analysis: Two-sided Fisher’s exact test. *p % 0.05, **p % 0.01, *** p % 0.001, ****p % 0.0001. See also Figure S7.
Figure 7.
Figure 7.. ATG7−/− Clones Are Dependent on NRF2 for Survival
(A–G) Incucyte live cell imaging of (A and B) BT459 cells transduced with shNS or shNRF2. (A) KD of NRF2 induced effects on growth. Data are represented as mean ± SD of the fold change in Incucyte mCherry+ cell count/mm2 for shNRF2 over shNS for technical replicates (N = 3) representative of 2 individual experiments. Statistical analysis: two-way ANOVA. (B) KD of NRF2 induced effects on apoptosis 8 days after transduction with indicated shRNAs measured as the fold change in CellEvent green count for shNRF2 relative to shNS. Data are represented as mean ± SD for technical replicates (N = 3) representative of 2 individual experiments. Statistical analysis: one-way ANOVA. (C–G) Normalized Caspase3/7 Cell Event green in (C–F) parental BT549 mCherry-NLS cells with (C and D) stable overexpression of EV or NRF2-flag or (E and F) shNS or shRNAs targeting KEAP1 or (G) BT549 WT or ATG7−/− with KD of NRF2. (C and E) Data represented as the mean fold change in treated over untreated cells ± SEM over time or (D and F) 3 days after treatment with indicated doses of CQ for technical replicates (N = 3) and representative of 2 individual experiments. Statistical analysis: two-way ANOVA. Inset: western blot of stable lines overexpressing NRF2. (G) After transduction with shNS or shNRF2 and treatment with bortezomib (100 nM) at indicated time points. Data are represented as the mean ± SEM for technical replicates (N of 3) and the graphs shown are representative of 2 individual experiments. Statistical analysis: two-way ANOVA. *p % 0.05, **p % 0.01, ***p %0.01, ****p % 0.001, *****p % 0.0001, significance indicated for the last time point for time course graphs. See also Figures S6 and S7.

References

    1. Alam J, Killeen E, Gong P, Naquin R, Hu B, Stewart D, Ingelfinger JR, and Nath KA (2003). Heme activates the heme oxygenase-1 gene in renal epithelial cells by stabilizing Nrf2. Am. J. Physiol. Renal Physiol 284, F743–F752. - PubMed
    1. Arlt A, Bauer I, Schafmayer C, Tepel J, Mu€erkö ster SS, Brosch M, Rö der C, Kalthoff H, Hampe J, Moyer MP, et al. (2009). Increased proteasome subunit protein expression and proteasome activity in colon cancer relate to an enhanced activation of nuclear factor E2-related factor 2 (Nrf2). Oncogene 28, 3983–3996. - PubMed
    1. Barretina J, Caponigro G, Stransky N, Venkatesan K, Margolin AA, Kim S, Wilson CJ, Lehá r J, Kryukov GV, Sonkin D, et al. (2012). The cancer cell line encyclopedia enables predictive modelling of anticancer drug sensitivity. Nature 483, 603–607. - PMC - PubMed
    1. Blomen VA, Má jek P, Jae LT, Bigenzahn JW, Nieuwenhuis J, Staring J, Sacco R, Van Diemen FR, Olk N, Stukalov A, et al. (2015). Gene essentiality and synthetic lethality in haploid human cells. Science 350, 1092–1096. - PubMed
    1. Bryant KL, Stalnecker CA, Zeitouni D, Klomp JE, Peng S, Tikunov AP, Gunda V, Pierobon M, Waters AM, George SD, et al. (2019). Combination of ERK and autophagy inhibition as a treatment approach for pancreatic cancer. Nat. Med 25, 628–640. - PMC - PubMed

Publication types

MeSH terms