. 2019 Aug 14;26(2):273-282.e7.
doi: 10.1016/j.chom.2019.07.002. Epub 2019 Aug 1.

Mapping Interactions of Microbial Metabolites with Human G-Protein-Coupled Receptors

Affiliations

Mapping Interactions of Microbial Metabolites with Human G-Protein-Coupled Receptors

Dominic A Colosimo et al. Cell Host Microbe. .

Abstract

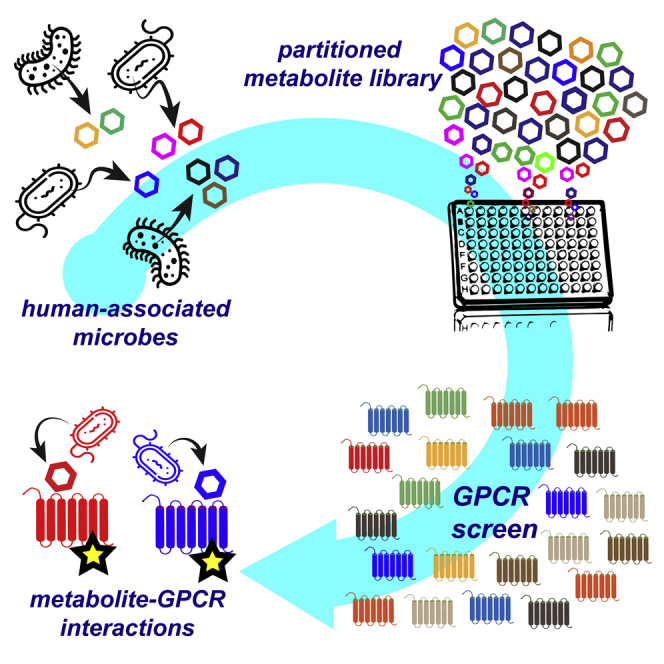
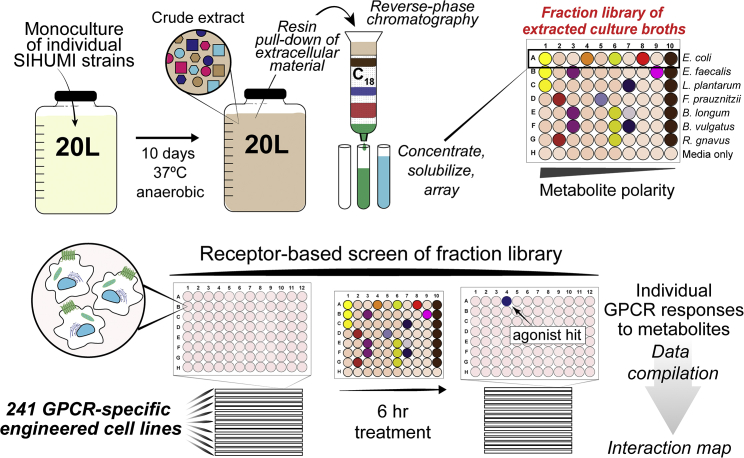
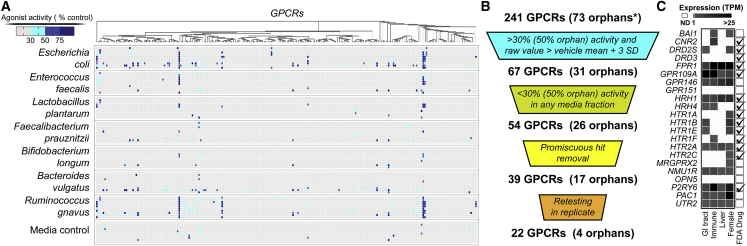
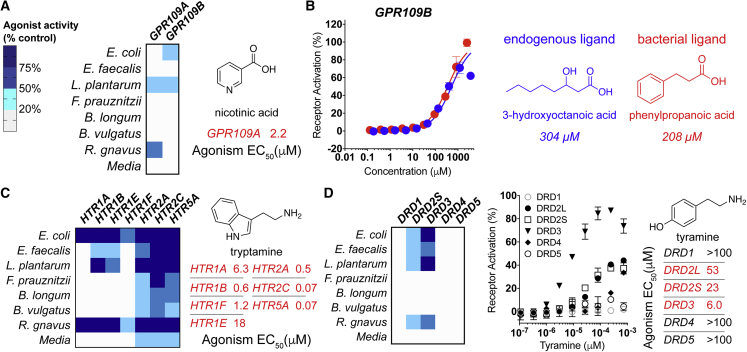
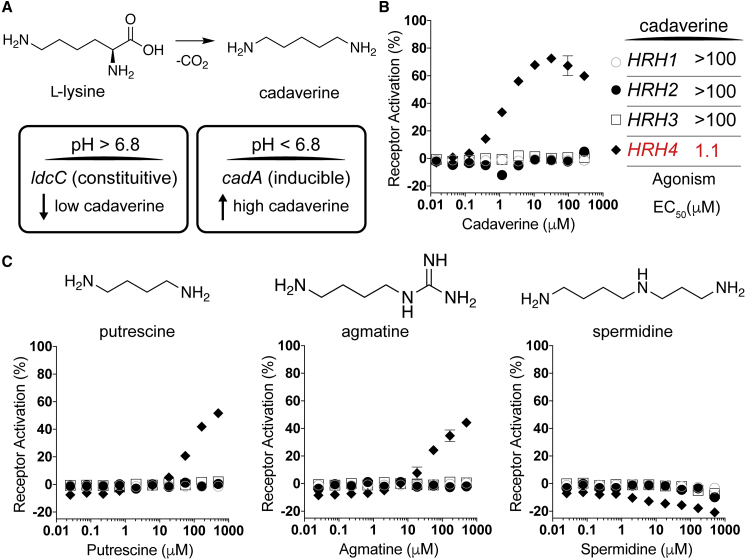
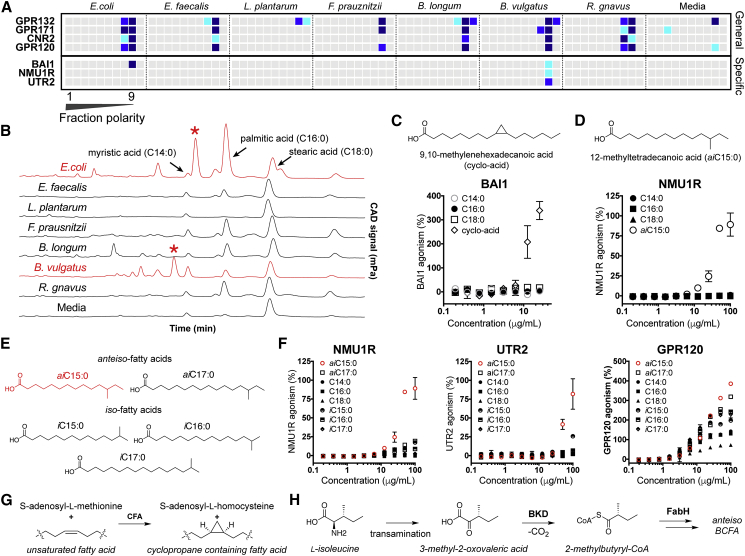
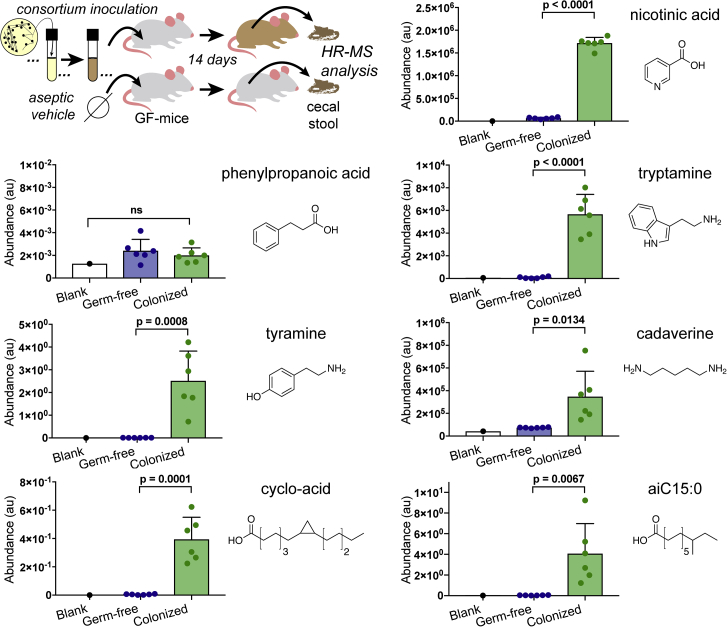
Despite evidence linking the human microbiome to health and disease, how the microbiota affects human physiology remains largely unknown. Microbiota-encoded metabolites are expected to play an integral role in human health. Therefore, assigning function to these metabolites is critical to understanding these complex interactions and developing microbiota-inspired therapies. Here, we use large-scale functional screening of molecules produced by individual members of a simplified human microbiota to identify bacterial metabolites that agonize G-protein-coupled receptors (GPCRs). Multiple metabolites, including phenylpropanoic acid, cadaverine, 9-10-methylenehexadecanoic acid, and 12-methyltetradecanoic acid, were found to interact with GPCRs associated with diverse functions within the nervous and immune systems, among others. Collectively, these metabolite-receptor pairs indicate that diverse aspects of human health are potentially modulated by structurally simple metabolites arising from primary bacterial metabolism.

Keywords: G protein-coupled receptors; human microbiome; primary metabolites.


Conflict of interest statement

S.F.B. is the founder of LODO Therapeutics. Patents related to this work are being filed.

Figures

None
Graphical abstract
Figure 1
Figure 1
Experimental Procedure for Generating and Screening Library of Secreted Bacterial Metabolites from Large-Scale Monocultures of SIHUMI Consortium Members This library was screened for the ability to agonize 241 distinct GPCRs.
Figure 2
Figure 2
Overview of GPCR Screening Results (A) Heatmap of individual assays for each GPCR tested, indicating β-arrestin recruitment response normalized to endogenous or synthetic control compound (100%). For each bacterial strain, the 9 fractions are vertically displayed followed by the crude extract of that strain. (B) GPCR hit prioritization scheme. (C) Subset of GPCRs that show <30% (50% for orphans) response to the media control but have >30% response (50% for orphans) to a bacterial fraction. The orphan receptors in this pool are BAI1, GPR146, GPR151, and OPN5. Receptor gene expression levels in tissues commonly exposed to the human microbiome [Transcripts per Million (TPM)]. Data is from the Human Protein Atlas (Uhlén et al., 2015). Receptors targeted by approved FDA drugs are indicated on the right (Sriram and Insel, 2018).
Figure 3
Figure 3
Bacterial Ligands for Hydroxycarboxylic Acid and Neurotransmitter Receptors The single fraction with maximum activity for each bacterial strain is depicted in heatmaps. (A) Left, heatmap depicting agonism of GPR109A and GPR109B by bacterial fractions. Right, agonist activity (EC50) of purified nicotinic acid against GPR109A. (B) Left, dose-response curves (DRCs) for known and previously unknown GPR109B agonists (right). (C) Left, heatmap depicting agonism of HTR receptors by culture broth extract fractions. Right, agonist activity (EC50) of tryptamine against HTRs. (D) Left, heatmap depicting agonism of DRD family receptors by culture broth extract fractions. Right, agonist activity (EC50) of tyramine against DRDs. All dose-response curves were run in duplicate. Error bars are standard deviation. Error bars that are shorter than the height of the symbol are not shown.
Figure 4
Figure 4
Cadaverine Is a Bacterial Ligand for a Specific Histamine Receptor (A) Top, schematic of cadaverine biosynthesis from L-lysine. Bottom, bacterial enzymes that catalyze this reaction include LydC, which is constitutively expressed and CadA, whose gene expression is induced at low pH. (B) Dose-response curves for cadaverine against HRH family receptors. (C) Dose-response curves (bottom) of bacterial polyamines (above) against HRH family receptors. Receptor symbols are labeled as in (B). All dose-response curves were run in duplicate. Error bars are standard deviation. Error bars that are shorter than the height of the symbol are not shown.
Figure 5
Figure 5
Lipid Responsive GPCRs (A) Heatmap of GPCRs demonstrating general (top) or specific (bottom) responses to lipid-rich fractions of bacterial extracts. (B) Overlaid CAD chromatograms with common lipids and unique lipids (red asterisk) are marked. (C) Structure of BAI1-active lipid 9,10-methylenehexadecanoic acid isolated from E. coli LF82, and the response of BAI1 to various fatty acids. (D) Structure of NMU1R-active lipid, 12-methyltetradecanoic acid isolated from B. vulgatus, and the response of NMU1R GPCR to various fatty acids. (E) Panel of branched chain fatty acids tested for GPCR fidelity. (F) Response of NMU1R, UTR2 (specific), and GPR120 (general) to branched chain fatty acid panel. (G) Biosynthesis of cyclopropane rings from unsaturated fatty acids using cyclopropane fatty acid synthase (CFA). (H) Early steps in the biosynthetic scheme for ante-iso branched chain fatty acids (BCFAs) in bacteria (BKD, branched-chain α-keto acid dehydrogenase and FabH, β-ketoacyl-acyl carrier protein synthase III). All dose-response curves were run in duplicate. Error bars are standard deviation. Error bars that are shorter than the height of the symbol are not shown.
Figure 6
Figure 6
Comparative Analysis of Metabolite Levels in the Cecum of Abiotic Mice to Levels in Mice Inoculated with SIHUMI Consortium Metabolite presence in lumen cecal samples was determined by targeted mass spectrometry. Samples were normalized to each other based on the addition of isotopically labeled internal standards during extraction, n = 6, error bars are standard deviation, p values are derived from the unpaired t test.

Comment in

  • The Gut Feeling: GPCRs Enlighten the Way.
    Pandey S, Maharana J, Shukla AK. Pandey S, et al. Cell Host Microbe. 2019 Aug 14;26(2):160-162. doi: 10.1016/j.chom.2019.07.018. Cell Host Microbe. 2019. PMID: 31415748 Free PMC article.

References

    1. Ahmed K., Tunaru S., Langhans C.D., Hanson J., Michalski C.W., Kölker S., Jones P.M., Okun J.G., Offermanns S. Deorphanization of GPR109B as a receptor for the β-oxidation intermediate 3-OH-octanoic acid and its role in the regulation of lipolysis. J. Biol. Chem. 2009;284:21928–21933. - PMC - PubMed
    1. An D., Oh S.F., Olszak T., Neves J.F., Avci F.Y., Erturk-Hasdemir D., Lu X., Zeissig S., Blumberg R.S., Kasper D.L. Sphingolipids from a symbiotic microbe regulate homeostasis of host intestinal natural killer T cells. Cell. 2014;156:123–133. - PMC - PubMed
    1. Bhattarai Y., Williams B.B., Battaglioli E.J., Whitaker W.R., Till L., Grover M., Linden D.R., Akiba Y., Kandimalla K.K., Zachos N.C. Gut microbiota-produced tryptamine activates an epithelial G-protein-coupled receptor to increase colonic secretion. Cell Host Microbe. 2018;23:775–785. - PMC - PubMed
    1. Billings E.A., Lee C.S., Owen K.A., D'Souza R.S., Ravichandran K.S., Casanova J.E. The adhesion GPCR BAI1 mediates macrophage ROS production and microbicidal activity against Gram-negative bacteria. Sci. Signal. 2016;9:ra14. - PMC - PubMed
    1. Brighton P.J., Szekeres P.G., Willars G.B. Neuromedin U and its receptors: structure, function, and physiological roles. Pharmacol. Rev. 2004;56:231–248. - PubMed

Publication types

MeSH terms

LinkOut - more resources