. 2019 Dec;8(12):1296-1305.
doi: 10.1002/sctm.19-0043. Epub 2019 Aug 4.

Cell Mass Increase Associated with Formation of Glucose-Controlling β-Cell Mass in Device-Encapsulated Implants of hiPS-Derived Pancreatic Endoderm

Affiliations

Cell Mass Increase Associated with Formation of Glucose-Controlling β-Cell Mass in Device-Encapsulated Implants of hiPS-Derived Pancreatic Endoderm

Thomas Robert et al. Stem Cells Transl Med. 2019 Dec.

Abstract

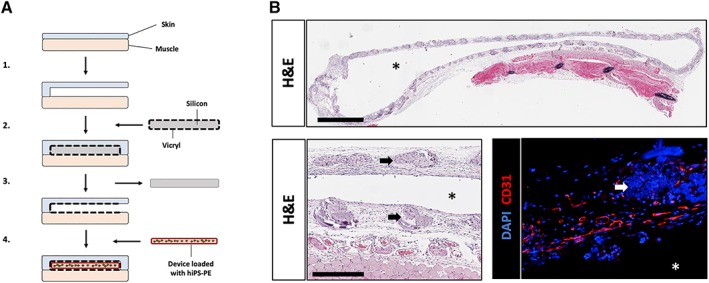
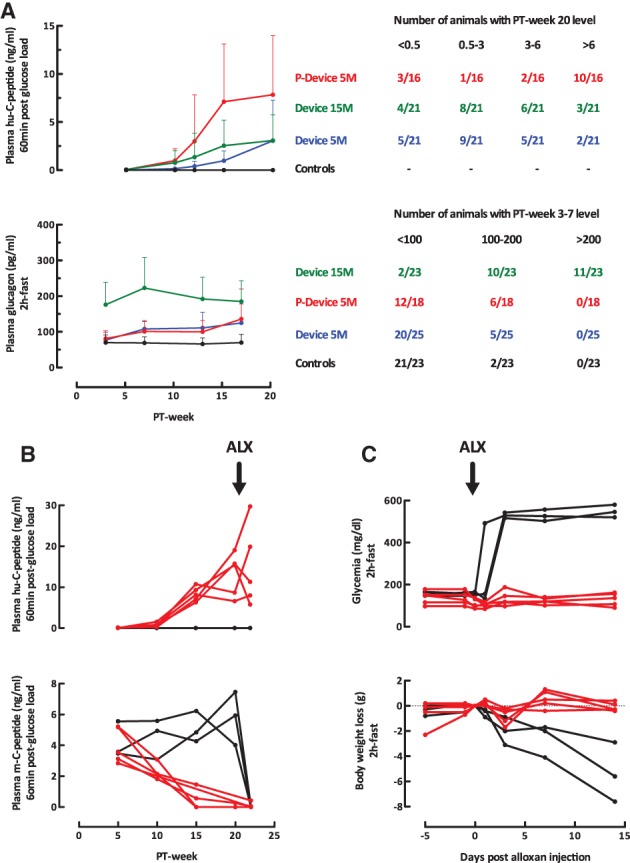
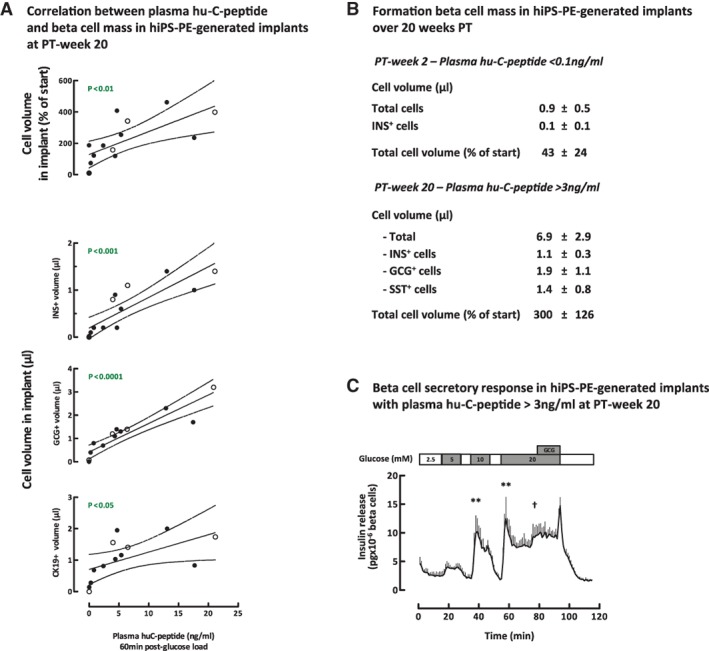
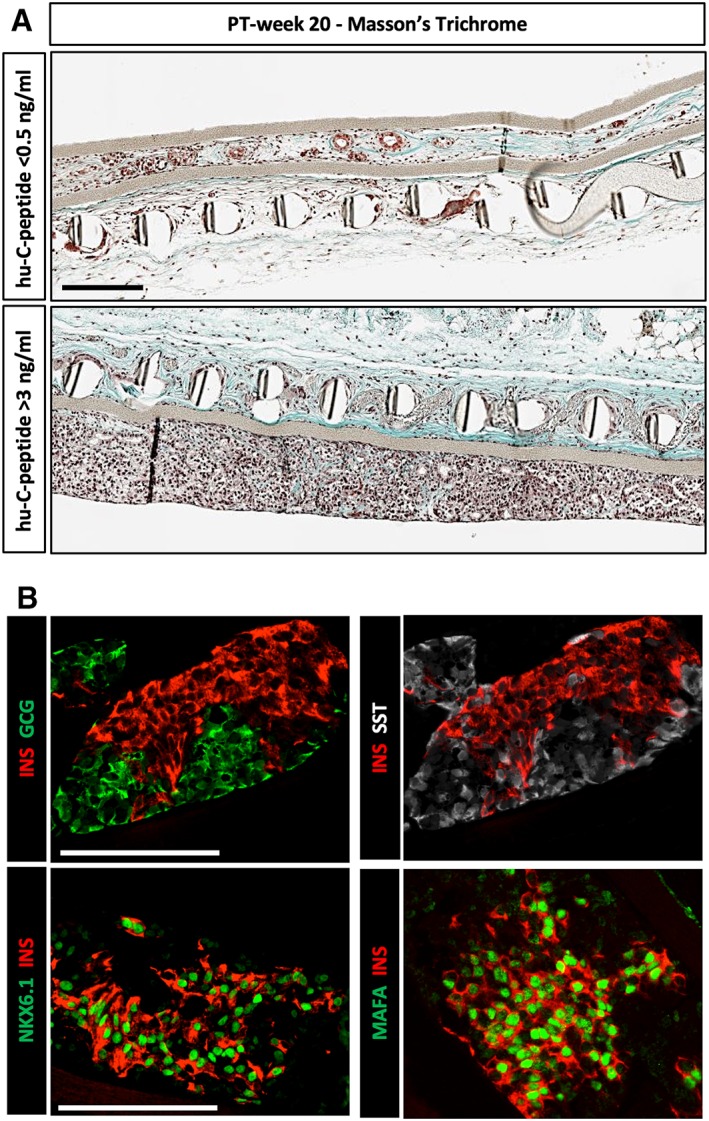
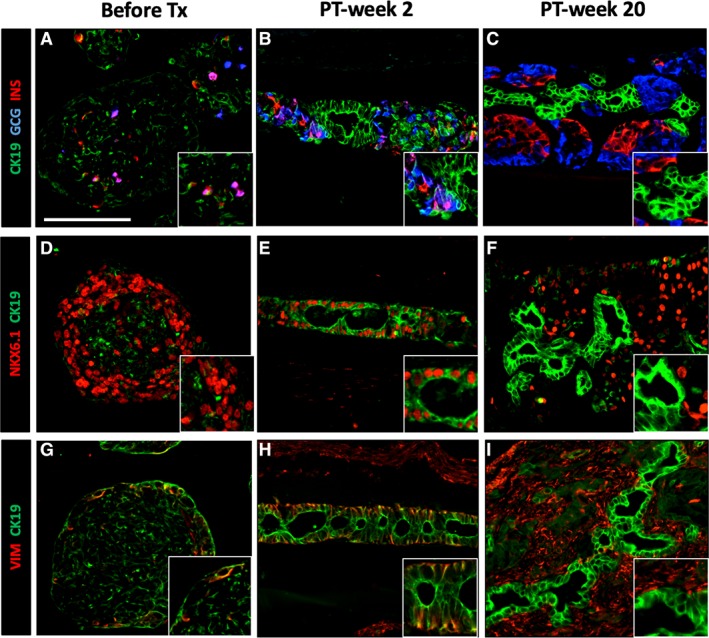
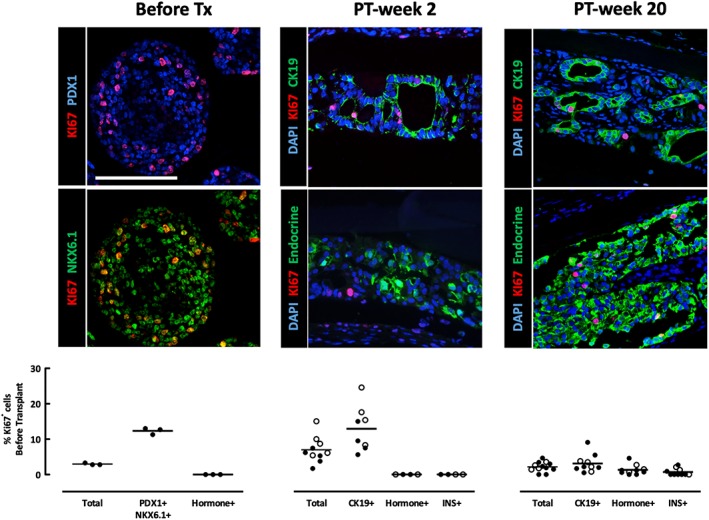
Device-encapsulated human stem cell-derived pancreatic endoderm (PE) can generate functional β-cell implants in the subcutis of mice, which has led to the start of clinical studies in type 1 diabetes. Assessment of the formed functional β-cell mass (FBM) and its correlation with in vivo metabolic markers can guide clinical translation. We recently reported ex vivo characteristics of device-encapsulated human embryonic stem cell-derived (hES)-PE implants in mice that had established a metabolically adequate FBM during 50-week follow-up. Cell suspensions from retrieved implants indicated a correlation with the number of formed β cells and their maturation to a functional state comparable to human pancreatic β cells. Variability in metabolic outcome was attributed to differences in number of PE-generated β cells. This variability hinders studies on processes involved in FBM-formation. This study reports modifications that reduce variability. It is undertaken with device-encapsulated human induced pluripotent stem cell-derived-PE subcutaneously implanted in mice. Cell mass of each cell type was determined on intact tissue inside the device to obtain more precise data than following isolation and dispersion. Implants in a preformed pouch generated a glucose-controlling β-cell mass within 20 weeks in over 60% of recipients versus less than 20% in the absence of a pouch, whether the same or threefold higher cell dose had been inserted. In situ analysis of implants indicated a role for pancreatic progenitor cell expansion and endocrine differentiation in achieving the size of β- and α-cell mass that correlated with in vivo markers of metabolic control. Stem Cells Translational Medicine 2019;8:1296&1305.

Keywords: Cell transplantation; Diabetes; Induced pluripotent stem cells; Pancreatic differentiation; Progenitor cells.


Conflict of interest statement

T.R. is Ph.D. fellow of Research Foundation Flanders‐FWO. The other authors indicated no potential conflicts of interest.

Figures

Figure 1
Figure 1
Pretreatment of implant site by forming tissue pouch in subcutaneous space. (A): Medical‐grade silicon sheets (Invotec, FL) are cut according to the size of our devices and sewn into Vicryl bags (Ethicon, NJ) using surgical wire. A subcutaneous space is created by separating the skin and muscle layers before inserting the silicon‐Vicryl pocket and stitching the wound. After 5 weeks of healing, the silicon sheet can be easily retrieved from the pocket without any tissue attachment. A device loaded with human induced pluripotent stem cell‐derived pancreatic endoderm cells is then inserted in the location of the silicon, before closing the wound. (B): Histology of PT‐week 5 pouches shows engraftment and vascularization of the Vicryl mesh (Hematoxylin–Eosin; scale bar = 2 mm on top, 500 μm on lower left; and immunofluorescent staining for CD31, lower right; scale bar: 250 μm). Stars indicate the lumen of the tissue pouch. Arrows indicate remnants of Vicryl fibers (lower left).
Figure 2
Figure 2
In vivo markers of implant function in recipients of device‐encapsulated human induced pluripotent stem cell‐derived pancreatic endoderm. (A): Plasma human (hu‐)C‐peptide levels (60 minutes postglucose load, 3 g/kg body weight, intraperitoneal) and plasma glucagon levels (basal, after 2 hours fast). Left part shows averages ± SD over the 20‐week follow‐up period of subgroups with 5 or 15 million cells at start with or without preformed pouch (P). Plasma hu‐C‐peptide <0.1 ng/ml (assay limit of detection) was considered as zero. Right part tabulates number of animals per subgroup according to the change in hormone levels. (B, C): Recipients of P‐Device with plasma hu‐C‐peptide levels >6 ng/ml (n = 5; red curves) and age‐matched controls (n = 3; black curves) were injected with alloxan (50 mg/kg BW) at post‐transplant week 20 and followed for plasma hu‐C‐peptide and mouse (m‐)C‐peptide levels (60 minutes postglucose load), basal glycemia, (2 hours fast) and body weight.
Figure 3
Figure 3
Correlation between glucose‐induced plasma hu‐C‐peptide levels and pancreatic endocrine cell mass in device‐encapsulated human induced pluripotent stem cell‐derived pancreatic endoderm (hiPS‐PE) implants at post‐transplant (PT)‐week 20. (A): In situ cell mass measurements (as volume) in devices at PT‐week 20 with initially 5 × 106 hiPS‐PE cells are plotted against the corresponding glucose‐induced plasma hu‐C‐peptide levels. Linear regression analysis indicates high correlations for the volumes of insulin‐ (μl) and of glucagon‐ (μl) positive cells and lower correlations for the volume of CK19‐positive cells (μl) and total cell volume (expressed as percent of initial volume). (B): In situ total and hormone‐positive cell mass in devices of pouch‐implants with plasma hu‐C‐peptide >3 ng/ml at PT‐week 20. Comparison with values at PT‐week 2 (no hu‐C‐peptide detected). (C): ex vivo β‐cell secretory response of pouch‐implants retrieved from mice with plasma hu‐C‐peptide >3 ng/ml. Glucose concentrations are indicated on top. Curve shows insulin release at baseline (2.5 mmol/l glucose) and at higher glucose concentration in absence and presence of glucagon (10 nmol/l). Data are expressed as pg × 10−3 β cells × minute−1. Statistical differences in first‐phase insulin release peaks at 5–10–20 mmol/l glucose versus baseline, by one‐way analysis of variance with Tukey's post hoc test: **, p < .01. Student's t test of second‐phase release at 20 mmol/l glucose with or without glucagon: , p < .05.
Figure 4
Figure 4
Pancreatic endocrine cells in device‐encapsulated human induced pluripotent stem cell‐derived pancreatic endoderm (hiPS‐PE) implants at post‐transplant (PT)‐week 20. (A): In situ histological analysis of device‐implants at PT‐week 20 and stained with Masson's trichrome, illustrating cell recovery and phenotype in implants from recipients without or with glucose‐stimulated plasma hu‐C‐peptide (<0.5 ng/ml, top; >3 ng/ml, bottom). Scale bar: 100 μm. (B): In situ analysis of device‐implants in pouch with plasma hu‐C‐peptide levels >3 ng/ml at PT‐week 20. Presence of single‐hormone positive cells staining for insulin, glucagon, or somatostatin (top). Most insulin‐positive cells exhibit strong nuclear expression of transcription factors PDX1, NKX6.1 and MAFA (bottom). Scale bars: 100 μm.
Figure 5
Figure 5
Transient CK19‐expression in pancreatic progenitor cells in human induced pluripotent stem cell‐derived pancreatic endoderm (hiPS‐PE) implants. In situ histological analysis of device‐encapsulated hiPS‐PE implants at post‐transplant (PT)‐week 2 and 20, comparison with start preparation. The preparation at start contained 45%–55% PDX1+/NKX6.1+/hormone‐negative cells that are considered as pancreatic progenitors; they exhibited a weak and spotty CK19‐positivity (A, D, G). At PT‐week 2 (B, E, H), the majority of PDX1+/NKX6.1+ cells stained strongly positive for cytokeratin‐19 (CK19) with vimentin‐positivity (VIM) at their basal pole; they formed an epithelial cell layer around small cysts Adjacent cell clusters contained weakly CK19+ cells associated to small numbers of hormone‐positive cells (insulin, glucagon). At PT‐week 20 (C, F, I), the epithelial cell layer was formed by CK19‐positive that were negative for PDX1, NKX6.1, and VIM, while adjacent cell clusters contained PDX1+/NKX6.1+/insulin‐positive cells. Scale bar: 100 μm.
Figure 6
Figure 6
Identification of cells in proliferating activity in device‐encapsulated human induced pluripotent stem cell‐derived pancreatic endoderm (hiPS‐PE) implants. In situ analysis of device‐encapsulated hiPS‐PE implants for the presence and identification of KI67‐positive cells, and comparison with start preparation. Cell types were identified on basis of their staining for CK19 (cytokeratin‐19), insulin (INS), vimentin (VIM), and pancreatic endocrine (insulin plus glucagon plus somatostatin) markers. Scale bar: 100 μm. In the start preparation 96% ± 5% of KI67+ cells were located in PDX1+/NKX6.1+ pancreatic progenitor cells which exhibited 12% ± 1% KI67‐positive cells. At PT‐week 2, implants from the P‐Device condition (empty circles) tended to have a higher proliferation rate than the Device condition (filled circles; 9.1% ± 3.8% vs. 4.9% ± 2.2%, respectively), but this difference was not statistically significant. Virtually all KI67+ cells (100% ± 1%) were identified as CK19+ cells present in epithelial cell layers. At PT‐week 20, most KI67+ cells remained located in the CK19+ cell population of the epithelial cell layers, but the percentage of CK19+/KI67+ cells was significantly lower than at PT‐week 2 (2.4% ± 1.5%) but higher than the percentage of INS+/KI67+ cells (0.7% ± 1.0%).

References

    1. Kroon E, Martinson LA, Kadoya K et al. Pancreatic endoderm derived from human embryonic stem cells generates glucose‐responsive insulin‐secreting cells in vivo. Nat Biotechnol 2008;26:443–452. - PubMed
    1. Schulz TC, Young HY, Agulnick AD et al. A scalable system for production of functional pancreatic progenitors from human embryonic stem cells. PLoS One 2012;7:e37004. - PMC - PubMed
    1. Agulnick A, Ambruzs D, Moorman A et al. Insulin‐producing endocrine cells differentiated in vitro from human embryonic stem cells function in macroencapsulation devices in vivo. Stem Cells Translational Medicine 2015;4:1214–1222. - PMC - PubMed
    1. Motté E, Szepessy E, Suenens K et al. Composition and function of macroencapsulated human embryonic stem cell‐derived implants: Comparison with clinical human islet cell grafts. Am J Physiol Endocrinol Metab 2014;307:E838–E846. - PubMed
    1. Robert T, De Mesmaeker I, Stangé GM et al. Functional beta cell mass from device‐encapsulated hESC‐derived pancreatic endoderm achieving metabolic control. Stem Cell Rep 2018;10:739–750. - PMC - PubMed

Publication types

MeSH terms