

Bias Introduced by Multiple Head Coils in MRI Research: An 8 Channel and 32 Channel Coil Comparison
- PMID: 31379483
- PMCID: PMC6648353
- DOI: 10.3389/fnins.2019.00729
Bias Introduced by Multiple Head Coils in MRI Research: An 8 Channel and 32 Channel Coil Comparison
Abstract
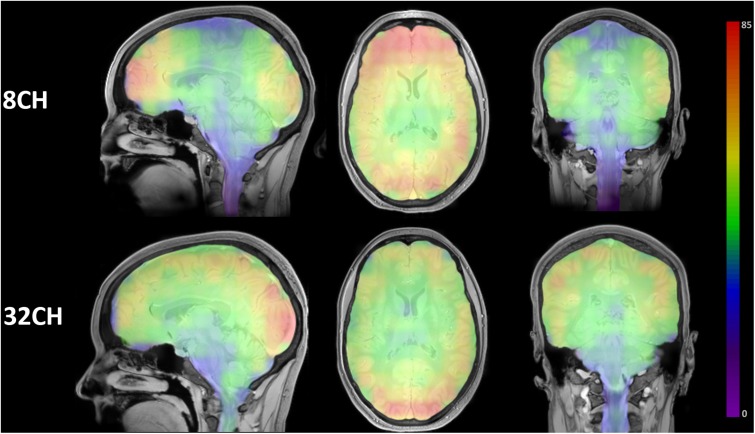
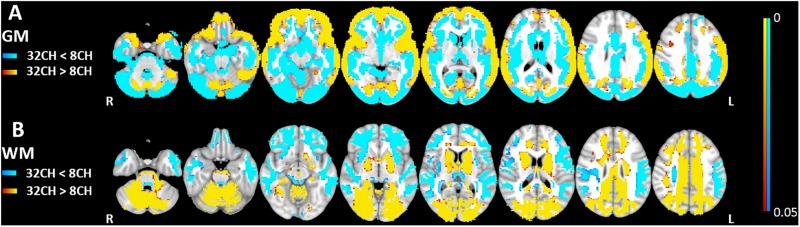
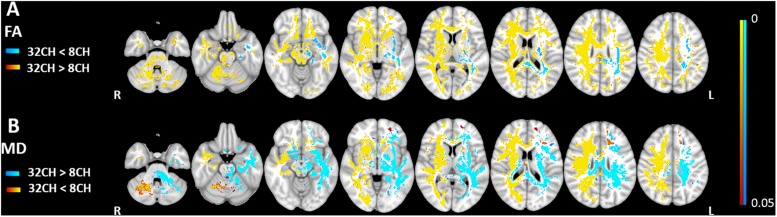
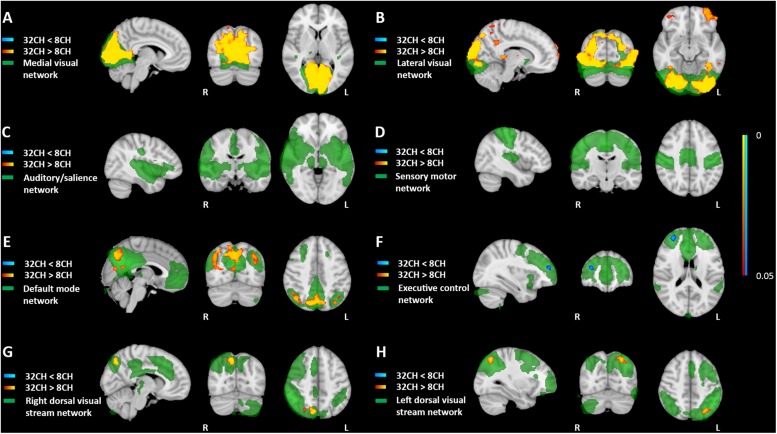
Neuroimaging MRI data in scientific research is increasingly pooled, but the reliability of such studies may be hampered by the use of different hardware elements. This might introduce bias, for example when cross-sectional studies pool data acquired with different head coils, or when longitudinal clinical studies change head coils halfway. In the present study, we aimed to estimate this possible bias introduced by using different head coils to create awareness and to avoid misinterpretation of results. We acquired, with both an 8 channel and 32 channel head coil, T1-weighted, diffusion tensor imaging and resting state fMRI images at 3T MRI (Philips Achieva) with stable acquisition parameters in a large group of cognitively healthy participants (n = 77). Standard analysis methods, i.e., voxel-based morphometry, tract-based spatial statistics and resting state functional network analyses, were used in a within-subject design to compare 8 and 32 channel head coil data. Signal-to-noise ratios (SNR) for both head coils showed similar ranges, although the 32 channel SNR profile was more homogeneous. Our data demonstrates specific patterns of gray and white matter volume differences between head coils (relative volume change of 6 to 9%), related to altered image contrast and therefore, altered tissue segmentation. White matter connectivity (fractional anisotropy and diffusivity measures) showed hemispherical dependent differences between head coils (relative connectivity change of 4 to 6%), and functional connectivity in resting state networks was higher using the 32 channel head coil in posterior cortical areas (relative change up to 27.5%). This study shows that, even when acquisition protocols are harmonized, the results of standardized analysis models can be severely affected by the use of different head coils. Researchers should be aware of this when combining multiple neuroimaging MRI datasets, to prevent coil-related bias and avoid misinterpretation of their findings.
Keywords: DTI; MRI; bias; gray matter; multicenter study; neuroimaging; white matter.
Figures
References
LinkOut - more resources
Full Text Sources