Critical Peripheral Fatigue Thresholds Among Different Force-Velocity Conditions: An Individual-Based Model Approach
- PMID: 31379595
- PMCID: PMC6646582
- DOI: 10.3389/fphys.2019.00875
Critical Peripheral Fatigue Thresholds Among Different Force-Velocity Conditions: An Individual-Based Model Approach
Abstract
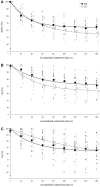
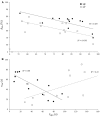
During high intensity exercise, metabosensitive muscle afferents are thought to inhibit the motor drive command to restrict the level of peripheral fatigue to an individual's critical threshold. No evidence exists of an individual relationship between peripheral fatigue and the decrease in voluntary activation reached after prolonged all-out exercise. Moreover, there is no explanation for the previously reported large decrease in voluntary activation despite low metabolic stress during high force contractions. Thirteen active men completed two maximal intensity isokinetic knee extension tests (160 contractions) under conditions of low force - high velocity and high force - low velocity. Neuromuscular testing including maximal torque, evoked torque and voluntary activation, was done every 20 contractions. The exponential modeling of these variables over time allowed us to predict the stable state (asymptote) and the rate of decrease (curvature constant). For both high and low force contractions the evoked torque and voluntary activation asymptotes were negatively correlated (R 2 = 0.49 and R 2 = 0.46, respectively). The evoked torque asymptotes of the high and low force conditions were positively correlated (R 2 = 0.49). For the high force contractions, the evoked torque and voluntary activation curvature constant were negatively correlated (R 2 = 0.43). These results support the idea that a restrained central motor drive keeps peripheral fatigue under this threshold. Furthermore, an individual would show similar fatigue sensibility regardless of the force generated. These data also suggest that the decrease in voluntary activation might not have been triggered by peripheral perturbations during the first high force contractions.
Keywords: evoked torque; exercise; group III/IV muscle afferents; performance; voluntary activation.
Figures


Similar articles
-
Neuromuscular fatigability amplitude and aetiology are interrelated across muscles.Exp Physiol. 2020 Oct;105(10):1758-1766. doi: 10.1113/EP088682. Epub 2020 Sep 7. Exp Physiol. 2020. PMID: 32822076
-
Time-Course of Neuromuscular Changes during and after Maximal Eccentric Contractions.Front Physiol. 2016 Apr 18;7:137. doi: 10.3389/fphys.2016.00137. eCollection 2016. Front Physiol. 2016. PMID: 27148075 Free PMC article.
-
The effect of sustained low-intensity contractions on supraspinal fatigue in human elbow flexor muscles.J Physiol. 2006 Jun 1;573(Pt 2):511-23. doi: 10.1113/jphysiol.2005.103598. Epub 2006 Mar 23. J Physiol. 2006. PMID: 16556656 Free PMC article.
-
A comparison of central aspects of fatigue in submaximal and maximal voluntary contractions.J Appl Physiol (1985). 2008 Feb;104(2):542-50. doi: 10.1152/japplphysiol.01053.2007. Epub 2007 Nov 21. J Appl Physiol (1985). 2008. PMID: 18032577 Review.
-
Alterations of neuromuscular function after prolonged running, cycling and skiing exercises.Sports Med. 2004;34(2):105-16. doi: 10.2165/00007256-200434020-00004. Sports Med. 2004. PMID: 14965189 Review.
Cited by
-
Strength-Endurance: Interaction Between Force-Velocity Condition and Power Output.Front Physiol. 2020 Oct 9;11:576725. doi: 10.3389/fphys.2020.576725. eCollection 2020. Front Physiol. 2020. PMID: 33162900 Free PMC article.
-
A comparison of individual force decline profiles during a fatiguing eccentric trunk flexion and extension protocol: a pilot study.Front Sports Act Living. 2024 Aug 21;6:1431607. doi: 10.3389/fspor.2024.1431607. eCollection 2024. Front Sports Act Living. 2024. PMID: 39234529 Free PMC article.
-
Testing the predictive capacity of a muscle fatigue model on electrically stimulated adductor pollicis.Eur J Appl Physiol. 2024 Dec;124(12):3619-3630. doi: 10.1007/s00421-024-05551-x. Epub 2024 Jul 25. Eur J Appl Physiol. 2024. PMID: 39052043
-
A model-based estimation of critical torques reduces the experimental effort compared to conventional testing.Eur J Appl Physiol. 2020 Jun;120(6):1263-1276. doi: 10.1007/s00421-020-04358-w. Epub 2020 Apr 10. Eur J Appl Physiol. 2020. PMID: 32277257 Free PMC article.
-
Sound production in piranhas is associated with modifications of the spinal locomotor pattern.J Exp Biol. 2021 May 1;224(9):jeb242336. doi: 10.1242/jeb.242336. Epub 2021 May 4. J Exp Biol. 2021. PMID: 33942099 Free PMC article.
References
-
- Amann M., Dempsey J. A. (2016). “Ensemble input of group III/IV muscle afferents to CNS: a limiting factor of central motor drive during endurance exercise from normoxia to moderate hypoxia,” in Hypoxia eds Roach R. C., Hackett P. H., Wagner P. D. (New York, NY: Springer; ) 325–342. 10.1007/978-1-4899-7678-9 - DOI - PubMed
LinkOut - more resources
Full Text Sources

