. 2019 Jul 17:10:1655.
doi: 10.3389/fmicb.2019.01655. eCollection 2019.

Fecal and Mucosal Microbiota Profiling in Irritable Bowel Syndrome and Inflammatory Bowel Disease

Affiliations

Fecal and Mucosal Microbiota Profiling in Irritable Bowel Syndrome and Inflammatory Bowel Disease

Alessandra Lo Presti et al. Front Microbiol. .

Abstract

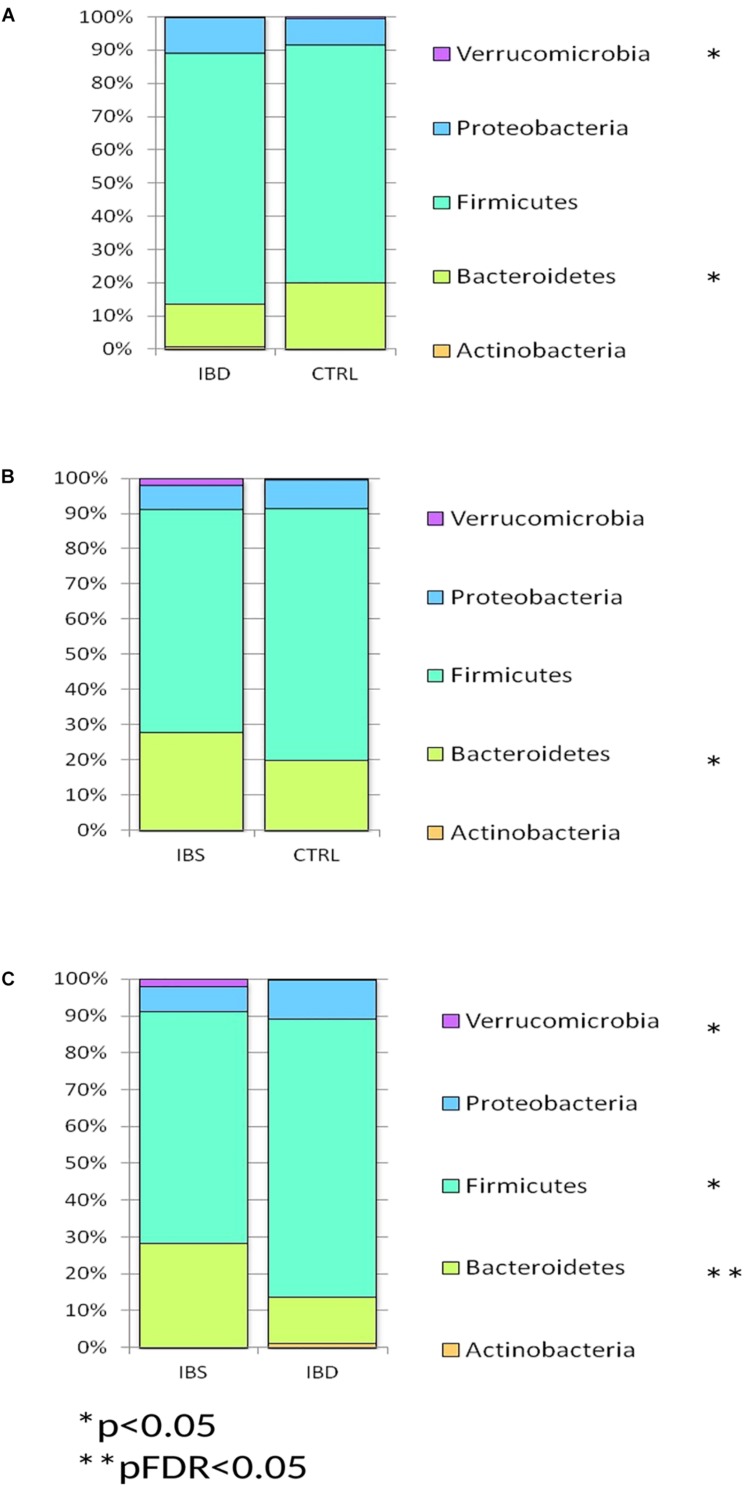
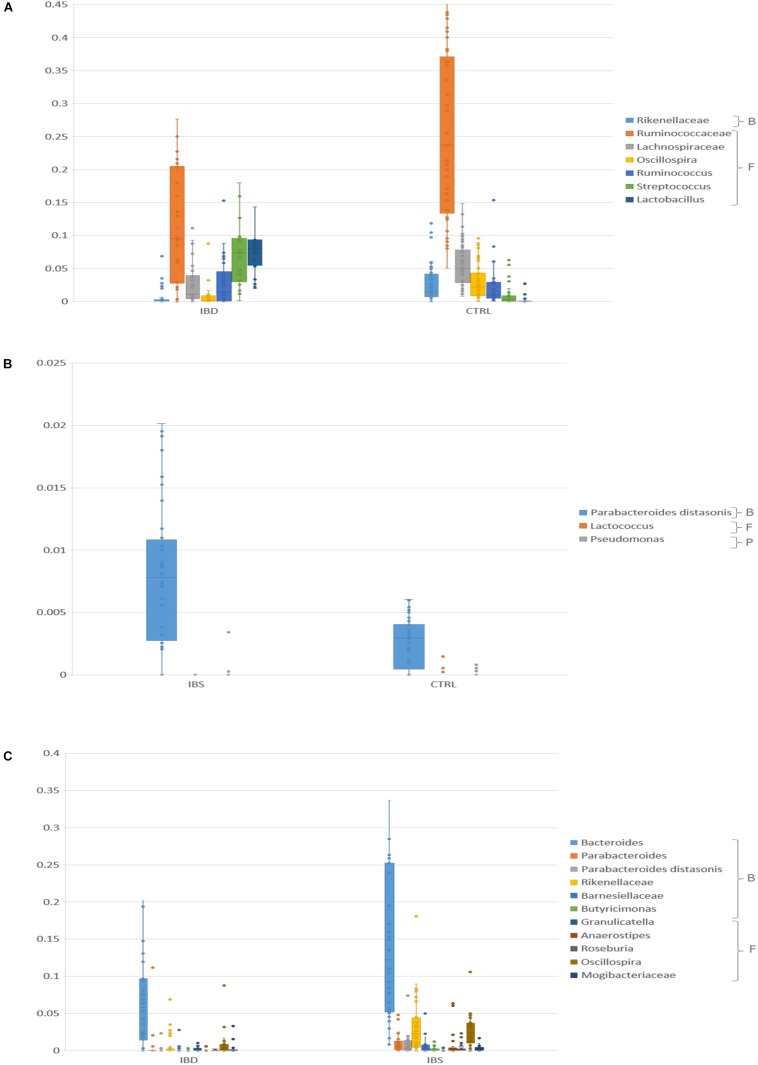
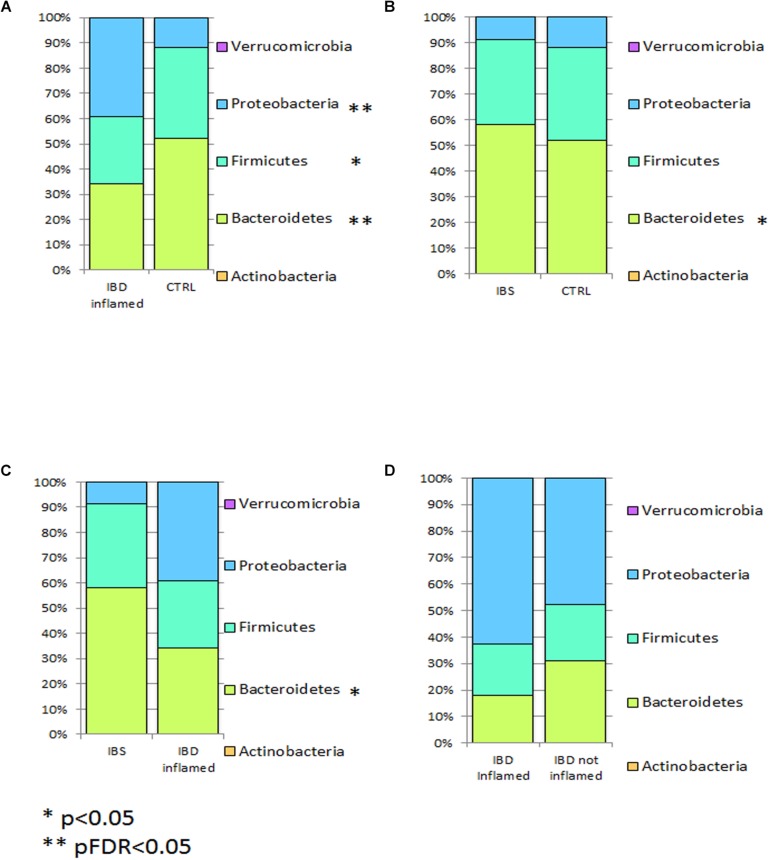
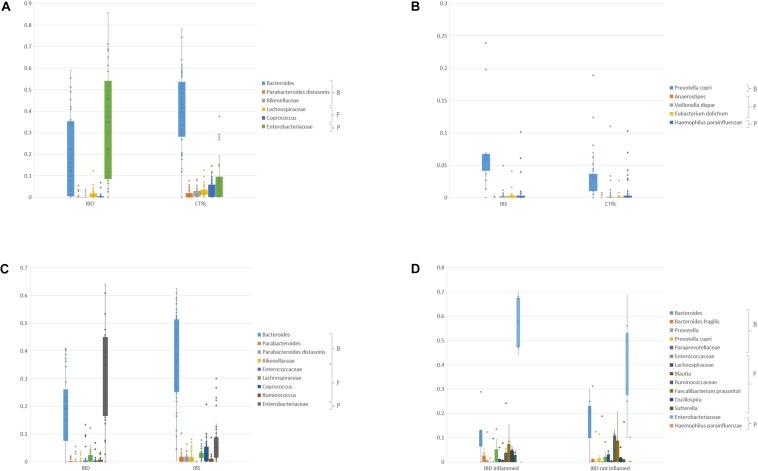
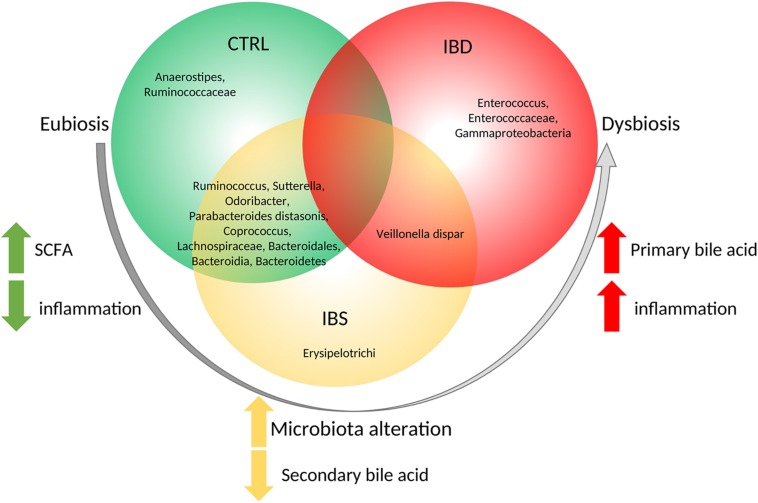
An imbalance in the bacterial species resulting in the loss of intestinal homeostasis has been described in inflammatory bowel diseases (IBD) and irritable bowel syndrome (IBS). In this prospective study, we investigated whether IBD and IBS patients exhibit specific changes in richness and distribution of fecal and mucosal-associated microbiota. Additionally, we assessed potential 16S rRNA gene amplicons biomarkers for IBD, IBS, and controls (CTRLs) by comparison of taxonomic composition. The relative abundance of bacteria, at phylum and genus/species levels, and the bacterial diversity were determined through 16S rRNA sequence-based fecal and mucosal microbiota analysis. Linear discriminant analysis effect size (LEfSe) was used for biomarker discovery associated to IBD and IBS as compared to CTRLs. In fecal and mucosal samples, the microbiota richness was characterized by a microbial diversity reduction, going from CTRLs to IBS to IBD. β-diversity analysis showed a clear separation between IBD and CTRLs and between IBD and IBS with no significant separation between IBS and CTRLs. β-diversity showed a clear separation between mucosa and stool samples in all the groups. In IBD, there was no difference between inflamed and not inflamed mucosa. Based upon the LEfSe data, the Anaerostipes and Ruminococcaceae were identified as the most differentially abundant bacterial taxa in CTRLs. Erysipelotrichi was identified as potential biomarker for IBS, while Gammaproteobacteria, Enterococcus, and Enterococcaceae for IBD. This study provides an overview of the alterations of microbiota and may aid in identifying potential 16S rRNA gene amplicons mucosal biomarkers for IBD and IBS.

Keywords: dysbiosis; gut microbiota; inflammation; inflammatory bowel disease; irritable bowel syndrome.


Figures

FIGURE 1
FIGURE 1
Bar chart reporting Kruskal-Wallis test results on OTUs grouped at taxonomic level of phylum for IBD vs. CTRL (A), IBS vs. CTRL (B), and IBD vs. IBS (C), in fecal samples. Fecal samples have been grouped and averaged in the comparisons IBD vs. CTRL (A), IBS vs. CTRL (B), and IBD vs. IBS (C). Each column in the plot represents a group, and each color in the column represents the percentage of relative abundance for each phyla.
FIGURE 2
FIGURE 2
Bar chart reporting Kruskal-Wallis test results on OTUs grouped at taxonomic level of families/species for IBD vs. CTRL (A), IBS vs. CTRL (B), and IBD vs. IBS (C), in fecal samples. Fecal samples have been grouped and averaged in the comparisons. For the IBD vs. CTRL (A) comparison, only OTUs that showed pFDR < 0.05 and relative abundance >0.01 were reported. For the IBS vs. CTRL (B) only OTUs that showed p < 0.05 were reported. For the IBD vs. IBS (C) comparison, only OTUs that showed pFDR < 0.05 were reported. B, Bacteroidetes, F, Firmicutes, P, Proteobacteria.
FIGURE 3
FIGURE 3
Bar chart reporting Kruskal-Wallis test results on mucosal OTUs grouped at taxonomic level of phylum for IBD vs. CTRL (A), IBS vs. CTRL (B), IBD vs. IBS (C), and IBD inflamed vs. not inflamed (D). Mucosal samples have been grouped and averaged in the comparisons IBD inflamed vs. CTRL (A), IBS vs. CTRL (B), IBD inflamed vs. IBS (C), and IBD inflamed vs. not inflamed (D). Each column in the plot represents a group, and each color in the column represents the percentage of relative abundance for each phyla. p values corrected for FDR were highlighted by star.
FIGURE 4
FIGURE 4
Bar chart reporting Kruskal-Wallis test results on mucosal OTUs of families/species for IBD inflamed vs. CTRL (A), IBS vs. CTRL (B), IBD inflamed vs. IBS (C), and IBD inflamed vs. not inflamed (D). For the IBD inflamed vs. CTRL (A) comparison only OTUs that showed pFDR < 0.05 and relative abundance >0.01 were reported. For the IBS vs. CTRL (B) only OTUs that showed p < 0.05 were reported. For the IBD vs. IBS (C) comparison, only OTUs that showed pFDR < 0.05 and relative abundance >0.01 were reported. For the IBD inflamed vs. not inflamed biopsies only OTUs that showed a relative abundance >0.01 were reported (D). B, Bacteroidetes, F, Firmicutes, P, Proteobacteria.
FIGURE 5
FIGURE 5
Descriptive model of microbiota composition and its role starting from eubiosis to dysbiosis based on biopsy samples. Model suggests that, in eubiosis condition, specific OTUs compose microbiota and maintain equilibrium. A microbiota alteration trigs the inflammation, leading to an increment of Erysipelotrichi and a reduction of secondary bile acid production. Then a further increment of inflammation leads to increase of primary bile producers with the consequence of dysbiosis.

Similar articles

Cited by

References

    1. Altomare A., Putignani L., Del Chierico F., Cocca S., Angeletti S., Ciccozzi M., et al. (2018). Gut mucosal-associated microbiota better discloses inflammatory bowel disease differential patterns than faecal microbiota. Dig. Liver Dis. 51 648–656. 10.1016/j.dld.2018.11.021 - DOI - PubMed
    1. Aries V., Crowther J. S., Drasar B. S., Hill M. J. (1969). Degradation of bile salts by human intestinal bacteria. Gut 10 575–576. 10.1136/gut.10.7.575 - DOI - PMC - PubMed
    1. Bäckhed F., Ley R. E., Sonnenburg J. L., Peterson D. A., Gordon J. I. (2005). Host-bacterial mutualism in the human intestine. Science 307 1915–1920. 10.1126/science.1104816 - DOI - PubMed
    1. Bajer L., Kverka M., Kostovcik M., Macinga P., Dvorak J., Stehlikova Z., et al. (2017). Distinct gut microbiota profiles in patients with primary sclerosing cholangitis and ulcerative colitis. World J. Gastroenterol. 23 4548–4558. 10.3748/wjg.v23.i25.4548 - DOI - PMC - PubMed
    1. Baumgart M., Dogan B., Rishniw M., Weitzman G., Bosworth B., Yantiss R., et al. (2007). Culture independent analysis of ileal mucosa reveals a selective increase in invasive Escherichia coli of novel phylogeny relative to depletion of Clostridiales in Crohn’s disease involving the ileum. ISME J. 1 403–418. 10.1038/ismej.2007.52 - DOI - PubMed

LinkOut - more resources