. 2019 Jul 11:2019:2061830.
doi: 10.1155/2019/2061830. eCollection 2019.

Lipid Profile and Aquaporin Expression under Oxidative Stress in Breast Cancer Cells of Different Malignancies

Affiliations

Lipid Profile and Aquaporin Expression under Oxidative Stress in Breast Cancer Cells of Different Malignancies

Claudia Rodrigues et al. Oxid Med Cell Longev. .

Abstract

Breast cancer is the major cause of tumor-associated mortality in women worldwide, with prognosis depending on the early discovery of the disease and on the type of breast cancer diagnosed. Among many factors, lipids could contribute to breast cancer malignancy by participating in cellular processes. Also, aquaporins are membrane channels found aberrantly expressed in cancer tissues that were correlated with tumor aggressiveness, progression, and metastasis. However, the differences in lipid profile and aquaporin expression between cell types of different malignant potential have never been investigated. Here, we selected three breast cancer cell lines representing the three major breast cancer types (hormone positive, HER2NEU positive, and triple negative) and analyzed their lipid profile and steady state lipid hydroperoxide levels to correlate with cell sensitivity to H2O2. Additionally, the expression profiles of AQP1, AQP3, and AQP5 and the Nrf2 transcription factor were evaluated, before and after oxidative challenge. We found that the lipid profile was dependent on the cell type, with the HER2-positive cells having the lowest level PUFA, whereas the triple negative showed the highest. However, in triple-negative cancer cells, a lower level of the Nrf2 may be responsible for a higher sensitivity to H2O2 challenge. Interestingly, HER2-positive cells showed the highest increase in intracellular ROS after oxidative challenge, concomitant with a significantly higher level of AQP1, AQP3, and AQP5 expression compared to the other cell types, with AQP3 always being the most expressed isoform. The AQP3 gene expression was stimulated by H2O2 treatment in hormone-positive and HER2NEU cells, together with Nrf2 expression, but was downregulated in triple-negative cells that showed instead upregulation of AQP1 and AQP5. The lipid profile and AQP gene expression after oxidative challenge of these particularly aggressive cell types may represent metabolic reprogramming of cancer cells and reflect a role in adaptation to stress and therapy resistance.


Figures
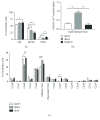
Figure 1
Figure 1
Lipid profile and steady state lipid hydroperoxide levels. (a) Composition of total fatty acids (%) of MCF7, SkBr3, and SUM159 cells. (b) Level of lipid hydroperoxide (LOOH) in MCF7, SkBr3, and SUM159 cells. (c) Specific analysis of individual fatty acids (%) in MCF7, SkBr3m and SUM159 cells. ALA: α-linolenic acid. Data are the mean ± SEM of three independent experiments. p < 0.05, ∗∗p < 0.01, and ∗∗∗p < 0.001.
Figure 2
Figure 2
Cell viability upon oxidative stress. Cell viability of MCF7, SkBr3, and SUM159 cell lines were determined by MTT assay after exposure to a range of H2O2 concentrations for 24 h. Data are the mean ± SEM of three independent experiments.
Figure 3
Figure 3
Antioxidant defense response upon oxidative stress. (a) ROS intracellular accumulation 60 minutes after H2O2 treatment. Cells were incubated with a range of H2O2 concentrations (10 μM to 100 μM), and ROS accumulation was recorded over 60 min. Data was normalized with basal levels of intracellular ROS. (b) Representative signals of fluorescence output after addition of 100 μM H2O2. (c) Nrf2 protein expression of treated (100 μM H2O2) vs. nontreated cells, normalized to GAPDH. (d) Nrf2 protein expression of cells treated (+) and nontreated (-) with 100 μM H2O2 (representative blots). p < 0.05, ∗∗p < 0.01, and ∗∗∗p < 0.001.
Figure 4
Figure 4
Effect of H2O2 treatment on aquaporin gene expression. AQP1, AQP3, and AQP5 mRNA expression was determined after treating cells with 100 μM H2O2 for 24 h. Data represent mean ± SEM from three independent experiments. p < 0.05 and ∗∗∗p < 0.001 versus nontreated cells.

References

    1. Dent R., Trudeau M., Pritchard K. I., et al. Triple-negative breast cancer: clinical features and patterns of recurrence. Clinical Cancer Research. 2007;13(15):4429–4434. doi: 10.1158/1078-0432.CCR-06-3045. - DOI - PubMed
    1. Verkman A. S., Hara-Chikuma M., Papadopoulos M. C. Aquaporins—new players in cancer biology. Journal of Molecular Medicine. 2008;86(5):523–529. doi: 10.1007/s00109-008-0303-9. - DOI - PMC - PubMed
    1. Al Ghouleh I., Frazziano G., Rodriguez A. I., et al. Aquaporin 1, Nox1, and Ask1 mediate oxidant-induced smooth muscle cell hypertrophy. Cardiovascular Research. 2013;97(1):134–142. doi: 10.1093/cvr/cvs295. - DOI - PMC - PubMed
    1. Miller E. W., Dickinson B. C., Chang C. J. Aquaporin-3 mediates hydrogen peroxide uptake to regulate downstream intracellular signaling. Proceedings of the National Academy of Sciences of the United States of America. 2010;107(36):15681–15686. doi: 10.1073/pnas.1005776107. - DOI - PMC - PubMed
    1. Bienert G. P., Chaumont F. Aquaporin-facilitated transmembrane diffusion of hydrogen peroxide. Biochimica et Biophysica Acta (BBA) - General Subjects. 2014;1840(5):1596–1604. doi: 10.1016/j.bbagen.2013.09.017. - DOI - PubMed

MeSH terms