. 2019 May 26;9(12):7005-7016.
doi: 10.1002/ece3.5267. eCollection 2019 Jun.

Macroevolution of arboreality in salamanders

Affiliations

Macroevolution of arboreality in salamanders

Erica K Baken et al. Ecol Evol. .

Abstract

Evolutionary theory predicts that selection in distinct microhabitats generates correlations between morphological and ecological traits, and may increase both phenotypic and taxonomic diversity. However, some microhabitats exert unique selective pressures that act as a restraining force on macroevolutionary patterns of diversification. In this study, we use phylogenetic comparative methods to investigate the evolutionary outcomes of inhabiting the arboreal microhabitat in salamanders. We find that arboreality has independently evolved at least five times in Caudata and has arisen primarily from terrestrial ancestors. However, the rate of transition from arboreality back to terrestriality is 24 times higher than the converse. This suggests that macroevolutionary trends in microhabitat use tend toward terrestriality over arboreality, which influences the extent to which use of the arboreal microhabitat proliferates. Morphologically, we find no evidence for an arboreal phenotype in overall body proportions or in foot shape, as variation in both traits overlaps broadly with species that utilize different microhabitats. However, both body shape and foot shape display reduced rates of phenotypic evolution in arboreal taxa, and evidence of morphological convergence among arboreal lineages is observed. Taken together, these patterns suggest that arboreality has played a unique role in the evolution of this family, providing neither an evolutionary opportunity, nor an evolutionary dead end.

Keywords: amphibian; macroevolution; microhabitat; phylogenetic comparative methods.


Conflict of interest statement

None declared.

Figures

Figure 1
Figure 1
Landmark placement for foot shape analysis. Eleven landmarks and ten semilandmarks captured foot shape for each specimen. Missing landmarks were estimated using interpolation
Figure 2
Figure 2
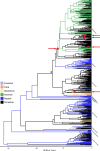
Time‐dated phylogeny for salamanders from Bonett and Blair (2017), pruned to the 495 species for which microhabitat data were available in this study. Tips are labeled using the 6‐M microhabitat classification scheme (see text), and branches are colored based on stochastic mapping node estimates. Red circles indicate likely transitions from terrestrial to arboreal microhabitats based on Bayesian stochastic mapping, and the root of Plethodontidae is marked with an asterisk. Red arrows assist in locating red circles
Figure 3
Figure 3
Heat map of Q‐matrix representing transition rates between microhabitat categories for Bayesian stochastic mapping. As is convention for Q‐matrices, rows represent the microhabitat type of origin, while columns represent the ending microhabitat type for each pairwise transition rate. Diagonals have been omitted. Each cell in the six‐by‐six Q‐matrix is divided into six subcells representing the six different classification schemes. The top three subcells represent the majority‐rule classification schemes (6‐M, 7‐M, and 6‐McM, left to right) and the bottom three cells represent the lenient classification schemes (6‐L, 7‐L, and 6‐McL, left to right). Microhabitat abbreviations are arboreal (A), cave (C), fossorial (F), saxicolous (S), semiaquatic (SA), terrestrial (T), and aquatic (W)
Figure 4
Figure 4
Number of transitions between microhabitat categories using the 6‐M microhabitat classification and Bayesian stochastic character mapping. Thickness of arrows is proportional to the number of transitions with a high of 63.2 (A to T) and a low of 0.763 (S to A). For exact numbers of transitions under all classification schemes, see Appendix S2
Figure 5
Figure 5
Phylomorphospace representing dispersion among species in their general body proportions and foot shape. Top panels show all species means colored by microhabitat classification (6‐M) for body shape and foot shape. The bottom panels represent the convex hulls defined by all species in a microhabitat type using 6‐M with notable overlap between the arboreal and other microhabitat type convex hulls. The first two axes of phylomorphospace describe 89.19% and 79.27% of the total variation for body and foot shape, respectively (PCA1Body = 73.86%; PCA2Body = 15.33%; PCA1Foot = 52.23%; PCA2Foot = 27.04%)

References

    1. Adams, D. C. (2014a). A method for assessing phylogenetic least squares models for shape and other high‐dimensional multivariate data. Evolution, 68, 2675–2688. 10.1111/evo.12463 - DOI - PubMed
    1. Adams, D. C. (2014b). Quantifying and comparing phylogenetic evolutionary rates for shape and other high‐dimensional phenotypic data. Systematic Biology, 63(2), 166–177. 10.1093/sysbio/syt105 - DOI - PubMed
    1. Adams, D. C. , Berns, C. M. , Kozak, K. H. , & Wiens, J. J. (2009). Are rates of species diversification correlated with rates of morphological evolution? Proceedings of the Royal Society B: Biological Sciences, 1668, 2729–2738. 10.1098/rspb.2009.0543 - DOI - PMC - PubMed
    1. Adams, D. C. , & Collyer, M. L. (2018). Phylogenetic ANOVA: Group‐clade aggregation, biological challenges, and a refined permutation procedure. Evolution, 72, 1204–1215. - PubMed
    1. Adams, D. C. , Collyer, M. L. , & Kaliontzopoulou, A. (2018). Geomorph: Software for geometric morphometric analyses. R package version 3.0.7. Retrieved from https://cran.r-project.org/package=geomorph

LinkOut - more resources