. 2019 May 15;6(14):1900304.
doi: 10.1002/advs.201900304. eCollection 2019 Jul 17.

Fast Acoustic Light Sculpting for On-Demand Maskless Lithography

Affiliations

Fast Acoustic Light Sculpting for On-Demand Maskless Lithography

Salvatore Surdo et al. Adv Sci (Weinh). .

Abstract

Light interference is the primary enabler of a number of optical maskless techniques for the large-scale processing of materials at the nanoscale. However, methods controlling interference phenomena can be limited in speed, ease of implementation, or the selection of pattern designs. Here, an optofluidic system that employs acoustic standing waves in a liquid to produce complex interference patterns at sub-microsecond temporal resolution, faster than the pulse-to-pulse period of many commercial laser systems, is presented. By controlling the frequency of the acoustic waves and the motion of a translation stage, additive and subtractive direct-writing of tailored patterns over cm2 areas with sub-wavelength uniformity in periodicity and scalable spatial resolution, down to the nanometric range, are demonstrated. Such on-the-fly dynamic control of light enhances throughput and design flexibility of optical maskless lithography, helping to expand its application portfolio to areas as important as plasmonics, electronics, or metamaterials.

Keywords: acusto‐optics; direct‐write; laser‐interference; nanotechnology; optofluidics.


Conflict of interest statement

The authors declare no conflict of interest.

Figures
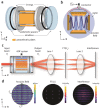
Figure 1
Figure 1
Working principle and experimental setup. a) Schematic of the main components of the acousto‐optofluidic system for light sculpting. For simplicity, the enclosed container and filling liquid are not included in the representation. b) Standing acoustic waves in the liquid generated by driving the x‐axis piezoelectric plates. c) Optical setup to generate interference patterns consisting of two converging lenses in a 4f configuration. The exit aperture of the AOF system is placed at the back focal plane of the first lens of the 4f system. d) Simulations of the phase or light intensity of a 635 nm Gaussian beam with a waist of 1 mm at 3 different locations of the optical setup: at the exit of the AOF system (acoustic field), at the Fourier plane of the first lens (FT(Uo)), and at the Fourier plane of the second lens (interference).
Figure 2
Figure 2
Light sculpting and modeling. a) Experimental images and simulations of different light patterns generated with synchronized pulsed illumination for an acoustic frequency of 1.5 MHz. Changing the time delay Δt between laser pulse and the AOF system enables sub‐microsecond temporal interference control. b) Average intensity profiles from (a). c) 3D characterization of a light pattern generated at 4.5 MHz. Scale bar along z‐axis: 40 mm. d) Examples of interference patterns and averaged intensity profiles obtained with CW light at different driving frequencies. From left to right, in MHz: fX = 1.4, fy = 1.4; fX = 1.5, fy = 1.4; fX = 4.5, fy = 4.6; and fX = 1.4, fy = 4.5. All scale bars are 500 µm unless specified.
Figure 3
Figure 3
Optical characterization of the AOF system. a) Simulated (blue line) and measured (symbols) contrast of an interference pattern generated at the acoustic frequency of 1.5 MHz. Insets show interference generated with 444 and 647 nm CW lasers. b) Mean values (symbols) and standard deviation (bars) of the step response—from rest (OFF) to steady‐state (ON)—of the AOF system. c) Temporal stability of an interference pattern at the acoustic frequency of 1.2 MHz. The inset shows the histogram of the correlation coefficients used to calculate the pattern stability. d) Measured interference contrast for an acoustic frequency of 7.5 MHz and peak‐to‐peak voltage V pp from 0 to 20 V. Insets show interferences at various voltages.
Figure 4
Figure 4
Large‐area structural coloring of metals. a) Scanning electron microscopy (SEM) image of a pattern with two distinct features (pixel 1 and pixel 2) obtained by snake scanning a palladium substrate while alternating the acoustic frequency between 1.2 and 1.8 MHz. The magnified SEM reveals nanoripples in the laser‐irradiated regions. b) Schematic of laser‐formed pixels consisting of periodic trenches with different spatial periods and hence structural colorations. The inset shows experimentally observed blue and red light simultaneously reflected by the array shown in (a). c) Examples of two large‐area (>4 mm2) patterns obtained as in (a) at different modulation rates (top, bottom). Two structural colors are observed by illuminating each pattern with a broadband light source at various angles of incidence. Scale bar 500 µm. d) Schematic of experimental setup used for reflectivity measurements (top). Experimental reflectance at θR = −27° of the array shown in (c) for an incident light with angle θin = 70°. Two distinct peaks in the spectrum confirm two structural colors on the same array (bottom).

References

    1. Nie Z., Kumacheva E., Nat. Mater. 2008, 7, 277. - PubMed
    1. Andrew T. L., Tsai H.‐Y., Menon R., Science 2009, 324, 917. - PubMed
    1. Campbell M., Sharp D. N., Harrison M. T., Denning R. G., Turberfield A. J., Nature 2000, 404, 53. - PubMed
    1. Müller‐Meskamp L., Kim Y. H., Roch T., Hofmann S., Scholz R., Eckardt S., Leo K., Lasagni A. F., Adv. Mater. 2012, 24, 906. - PubMed
    1. Priolo F., Gregorkiewicz T., Galli M., Krauss T. F., Nat. Nanotechnol. 2014, 9, 19. - PubMed

LinkOut - more resources