. 2019 Aug 5;15(8):e1007226.
doi: 10.1371/journal.pcbi.1007226. eCollection 2019 Aug.

Energy-efficient information transfer at thalamocortical synapses

Affiliations

Energy-efficient information transfer at thalamocortical synapses

Julia Jade Harris et al. PLoS Comput Biol. .

Abstract

We have previously shown that the physiological size of postsynaptic currents maximises energy efficiency rather than information transfer across the retinothalamic relay synapse. Here, we investigate information transmission and postsynaptic energy use at the next synapse along the visual pathway: from relay neurons in the thalamus to spiny stellate cells in layer 4 of the primary visual cortex (L4SS). Using both multicompartment Hodgkin-Huxley-type simulations and electrophysiological recordings in rodent brain slices, we find that increasing or decreasing the postsynaptic conductance of the set of thalamocortical inputs to one L4SS cell decreases the energy efficiency of information transmission from a single thalamocortical input. This result is obtained in the presence of random background input to the L4SS cell from excitatory and inhibitory corticocortical connections, which were simulated (both excitatory and inhibitory) or injected experimentally using dynamic-clamp (excitatory only). Thus, energy efficiency is not a unique property of strong relay synapses: even at the relatively weak thalamocortical synapse, each of which contributes minimally to the output firing of the L4SS cell, evolutionarily-selected postsynaptic properties appear to maximise the information transmitted per energy used.


Conflict of interest statement

The authors have declared that no competing interests exist.

Figures

Fig 1
Fig 1. Hodgkin-Huxley-type multicompartment model of a layer 4 spiny stellate cell (L4SS).
(A) To study energetic efficiency at thalamocortical synapses, we adapted a model of a L4SS cell [15]. The modelled cell receives excitatory (cc; red) and inhibitory (inh; blue) corticortical input, and thalamocortical input (tc; orange). Information transfer and energy consumption were investigated for input synapses from a single projecting thalamic neuron (syn; light violet). To model this additional projecting neuron, three synaptic contacts were added in close proximity along one dendritic branch. (B) Corticocortical input density (red and blue) for each type of synapse per μm2 of dendrite, as a function of distance from the soma over all dendrites. Thalamocortical input density followed a Gaussian probability distribution with respect to distance from the soma (orange; Gaussian with a mean of 83.6 μm and a standard deviation of 28.3 μm, transformed to show density per μm2; [19]). (C) The individual synaptic conductance values were the same for all synapses in one class. Excitatory conductances were adjusted to the values stated in Materials & Methods to generate EPSPs at the soma of ~0.6–0.8 mV depending on synapse location (plotted as mean ± standard deviation; ranges 0.29–2.65 mV for thalamocortical input and 0.25–2.32 mV for excitatory corticocortical input). Inhibitory conductances were set to produce IPSPs at the soma between 0.1 and 269 μV (mean 93 ± 31 μV), depending on synapse location. (D) Input from the projecting thalamic neuron of interest affects the output of the cell. Comparison between output generated by the background activity alone (black line; tc, cc and inh active) and when the projecting thalamic neuron of interest (syn) is activated on top of the background activity (light violet; timing of extra inputs marked as vertical bars above trace). The extra input is sufficient to alter the timing of output action potentials and, on occasion, to generate additional action potentials.
Fig 2
Fig 2. Postsynaptic conductance magnitude maximising information transferred per energy used in a model of spiny stellate cells.
(A) Energy use on reversing postsynaptic ion influx for the synaptic contacts of interest as a function of gsyn multiplier (in all simulations the same multiplier is applied to gtc, while gcc and ginh remain constant). In panels A to C, two datasets are presented (pink and violet; error bars stand for the standard deviation) which resulted from placement of the synaptic contacts of interest on different dendritic branches (pink: 53.6, 70.9 and 88.0 μm away from the soma; violet: 67.5, 80.3 and 106.9 μm away from the soma). The position of the synaptic contacts had no qualitative effect on the results. The initial information transfer for the second set of contacts was TEraw = 1.1 ± 0.1 bits/sec (as compared to 1.0 ± 0.1 bits/sec for the first set; TE = 0.47 ± 0.06 bits/sec is only calculated as an average over both datasets; mean ± s.e.m.). Additionally, in panels A to E, the average over both datasets is plotted (blue line; shaded areas stand for the standard error of the mean throughout). (B) Dependence of transfer entropy (between the specific input considered and the L4SS cell output) on mean output firing frequency evoked by input trains with different gsyn+tc multiplier values. Transfer entropy rates (TEraw) increase sigmoidally with the output firing frequency and plateau after approximately 20 Hz. As in panel A, the pink and violet traces stand for two different placements of the synaptic contacts of interest on different dendritic branches, while the blue line stands for the average over both datasets. Additionally, we plot TEnoise (black; mean ± s,e.m.) and the effective transfer entropy TE = TErawTEnoise (red; mean ± s.e.m.). See text and Materials & Methods for further details about the definition and meaning of TEraw, TEnoise and TE. (C) Dependence of the transfer entropy (TEraw) (“information”) on gsyn+tc multiplier plateaus as the multiplier is increased at a value slightly higher than its physiological value of 1. (D) Transfer entropy divided by energy use on reversing the ion influx at thalamocortical synapses shows a maximum at gsyn+tc multiplier value = 1. Both TEraw, the average over both datasets (blue), and TE (red) show maxima for metabolic efficiency of information transfer at 1. (E) Same as in D but when including the energetic cost of output action potentials in the calculation.
Fig 3
Fig 3. Inhibition modulates the position of peak energetic efficiency of information transfer.
Same as in Fig 2 when omitting inhibition (setting ginh to 0; see Materials & Methods). (A) Energy use on reversing postsynaptic ion influx for the synaptic contacts of interest as a function of gsyn multiplier. In panels A to C, two datasets omitting inhibition are presented (pink and violet; error bars stand for the standard deviation) which resulted from placement of the synaptic contacts of interest on the same different dendritic branches than in Fig 2. Like for Fig 2, the position of the synaptic contacts had no qualitative effect on the results. Additionally, in panels A to E, the average over both datasets is plotted (blue line; shaded areas stand for the standard error of the mean throughout). (B) Dependence of transfer entropy (between the specific input considered and the L4SS cell output) on mean output firing frequency evoked by input trains with different gsyn+tc multiplier values. Transfer entropy rates (TEraw) increase sigmoidally with the output firing frequency and plateau after approximately 20 Hz. Like in Fig 2, the blue line stands for the average over both datasets. Additionally, we plot TEnoise (black; mean ± s,e.m.) and the effective transfer entropy TE = TErawTEnoise (red; mean ± s.e.m.). (C) Dependence of the transfer entropy (TEraw) on gsyn+tc multiplier plateaus with the multiplier slightly higher than its physiological value of 1. Removal of inhibition slightly shifts the transition from 0 to maximal information transmission towards lower gain factors (compare with Fig 2C). (D) As a consequence, transfer entropy divided by energy use on reversing the ion influx at thalamocortical synapses shows a maximum at gsyn+tc multiplier < 1. Both TEraw, the average over both datasets (blue), and TE (red) show maxima for metabolic efficiency of information transfer at gain slightly < 1. (E) Same as in D but when including the energetic cost of output action potentials in the calculation. All curves peak at gain slightly < 1.
Fig 4
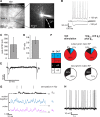
Fig 4. Characterisation of the thalamocortical synapse.
(A) Specimen dye-filled spiny stellate (SS) neuron: its position in the slice (left, ‘stim’ shows stimulator position for stimulation of thalamic axons), non-pyramidal dendrite morphology (right) and visible spines (inset). (B) Typical response of L4SS neurons to injected current. (C) Mean amplitude of the first excitatory postsynaptic current (EPSC), n = 6 cells. (D) Paired pulse ratio (2nd/1st EPSC) for 100 ms separation between pulses, n = 6 cells. (E) Typically, a mild paired pulse depression was observed with minimal stimulation (the vertical lines are stimulus artefacts 100 ms apart). (F) Observed input-output combinations (18ms search window, n = 6 cells) for presynaptic stimulation (left) and dynamic-clamp when noise is added (right). The possible combinations are given by the colour table (far left): input–no output (blue), input–output EPSP (red), input–output action potential (black), no input–output action potential (white). (G) L4SS neuron response in dynamic-clamp to injection of thalamocortical and corticocortical noise conductances, which were pre-scaled to achieve a firing frequency of ~4 Hz. (H) Specimen voltage response to injected conductances using dynamic-clamp. The synaptic conductance train recorded in response to presynaptic stimulation (gsyn) was added to the pre-scaled thalamocortical (gtc, 20% of input synapses) and corticocortical (gcc, 80% of input synapses) noise conductance trains. For dynamic-clamp injection, gsyn and gtc were multiplied by the same gain factor (1 for this recording), while gcc remained constant.
Fig 5
Fig 5. Comparison between real stimulation and dynamic-clamp.
(A) Transmitted information when cells (n = 6) were either stimulated through AP-evoked synaptic currents (real stimulation, left), or when the conductance evoked by real stimulation was injected at the soma with dynamic-clamp at gain 1, along with thalamocortical and corticocortical noise (right; difference n.s.; paired Student t-test). (B) ATP used on pumping out Na+ entering through the postsynaptic conductance, in voltage-clamp in response to thalamic axon stimulation (left), and following injection of the same conductance at the soma using dynamic clamp. When the postsynaptic conductance trace derived from presynaptic stimulation was not scaled (but noise from the corticocortical and thalamocortical inputs was injected), the postsynaptic energy use was very slightly but significantly reduced (by ~4%; p = 0.02; paired Student t-test) between the real stimulation (left) and when the conductance evoked by real stimulation was injected at the soma with dynamic-clamp at gain 1 (right).
Fig 6
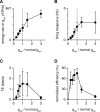
Fig 6. Energy efficiency at thalamocortical synapses.
(A) Energy use on ion flux associated with gsyn as a function of gsyn scaling. (B) L4SS firing frequency as a function of gsyn+tc scaling (while gcc injection remains constant). (C) Dependence of information transmission on gsyn+tc scaling. Scaling of gsyn+tc /(normal gsyn+tc)*1 was applied to all 6 cells, *0.3 to 3 cells, *0.5 to 4 cells, *0.75 to 5 cells, *1.5 to 5 cells, and *3 to 4 cells. Like for the simulations, TE is the result of subtracting TEnoise from TEraw (see Eq (2) and discussion in Materials & Methods). To ensure significance of the results, we tested that both TEnoise and TEraw are significantly larger than 0 (Student t-test; pnoise = 1.2*10−13 and praw = 0.0014) and that TEraw > TEnoise (paired Student t-test; pdiff = 0.004). (D) Energy efficiency (information in bits/sec divided by EPSC energy in ATP/sec normalized to the peak for each cell) curves for the averaged data over 6 cells. In all panels, error bars stand for the s.e.m. and broken lines only connect data points for visual guidance.

References

    1. Attwell D, Laughlin SB. An energy budget for signaling in the grey matter of the brain. JCBFM. 2001;21:1133–45. - PubMed
    1. Jolivet R, Magistretti PJ, Weber B. Deciphering neuron-glia compartmentalization in cortical energy metabolism. Front Neuroenerg. 2009;1:4. - PMC - PubMed
    1. Howarth C, Gleeson P, Attwell D. Updated energy budgets for neural computation in the neocortex and cerebellum. JCBFM. 2012;32(7):1222–32. 10.1038/jcbfm.2012.35 PubMed PMID: WOS:000305970800010. - DOI - PMC - PubMed
    1. Harris JJ, Jolivet R, Attwell D. Synaptic Energy Use and Supply. Neuron. 2012;75(5):762–77. 10.1016/j.neuron.2012.08.019 PubMed PMID: WOS:000308684300005. - DOI - PubMed
    1. Jolivet R, Coggan JS, Allaman I, Magistretti PJ. Multi-timescale Modeling of Activity-Dependent Metabolic Coupling in the Neuron-Glia-Vasculature Ensemble. PLOS Comput Biol. 2015;11(2):e1004036. doi: UNSP e1004036 10.1371/journal.pcbi.1004036 PubMed PMID: WOS:000352081000012. - DOI - PMC - PubMed

Publication types

LinkOut - more resources