. 2019 Aug 5;15(8):e1007995.
doi: 10.1371/journal.ppat.1007995. eCollection 2019 Aug.

Bipartite interface of the measles virus phosphoprotein X domain with the large polymerase protein regulates viral polymerase dynamics

Affiliations

Bipartite interface of the measles virus phosphoprotein X domain with the large polymerase protein regulates viral polymerase dynamics

Venice Du Pont et al. PLoS Pathog. .

Abstract

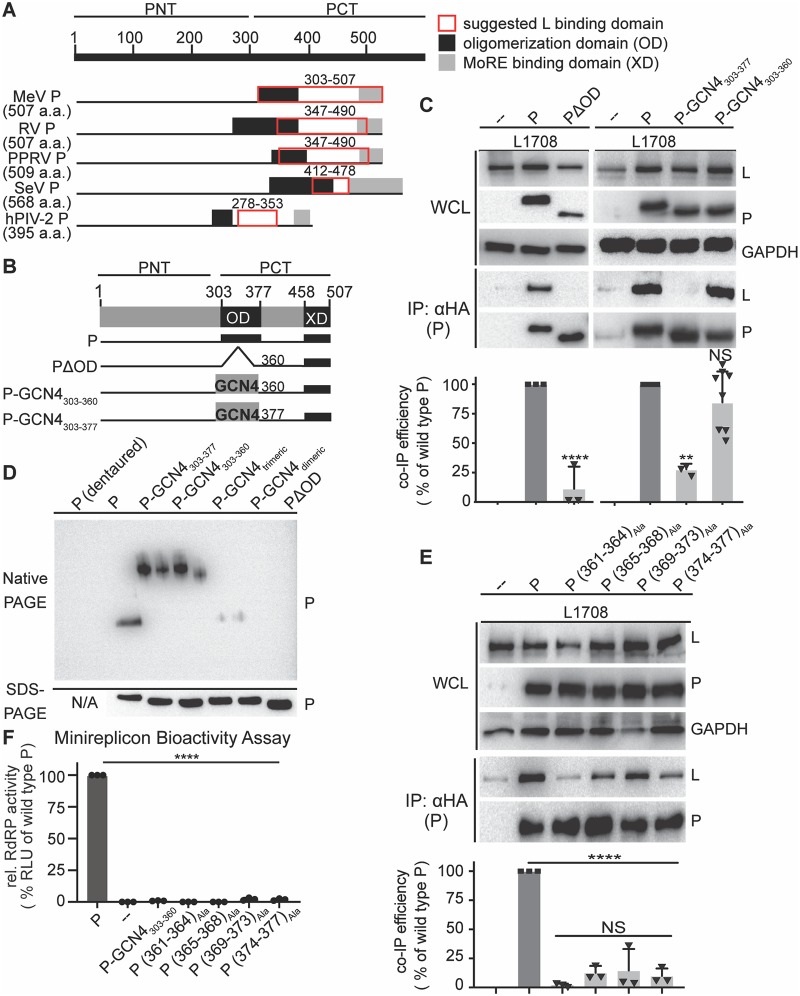
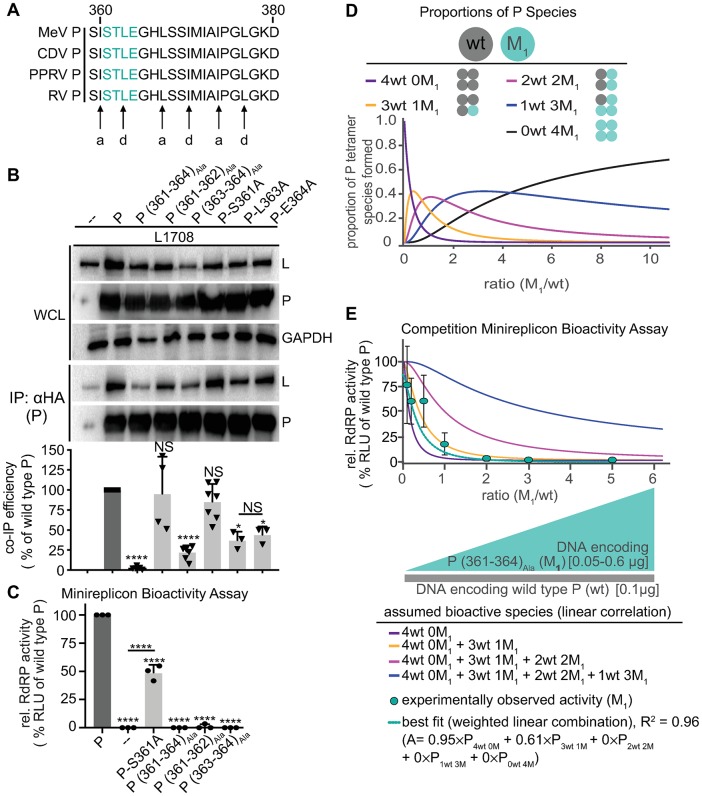
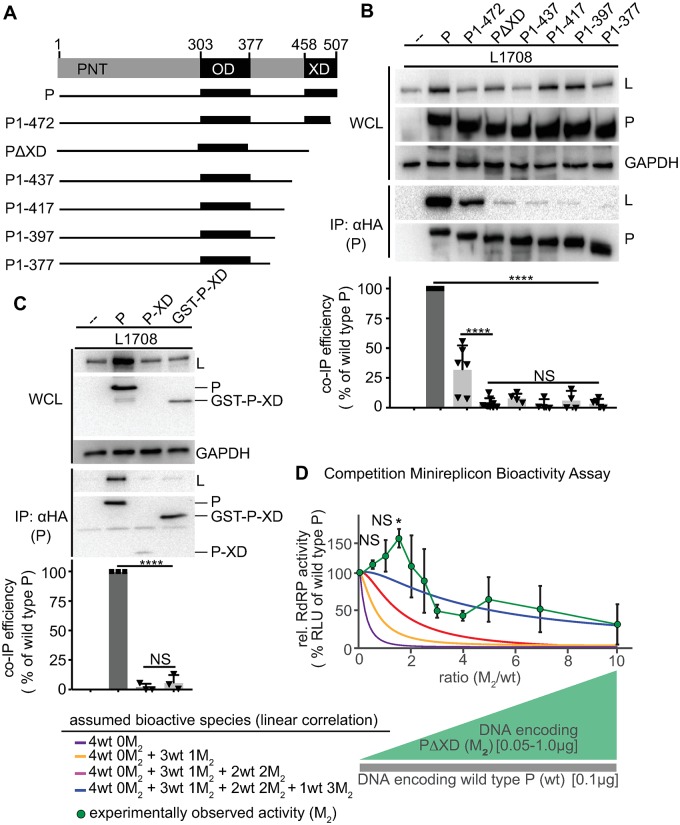
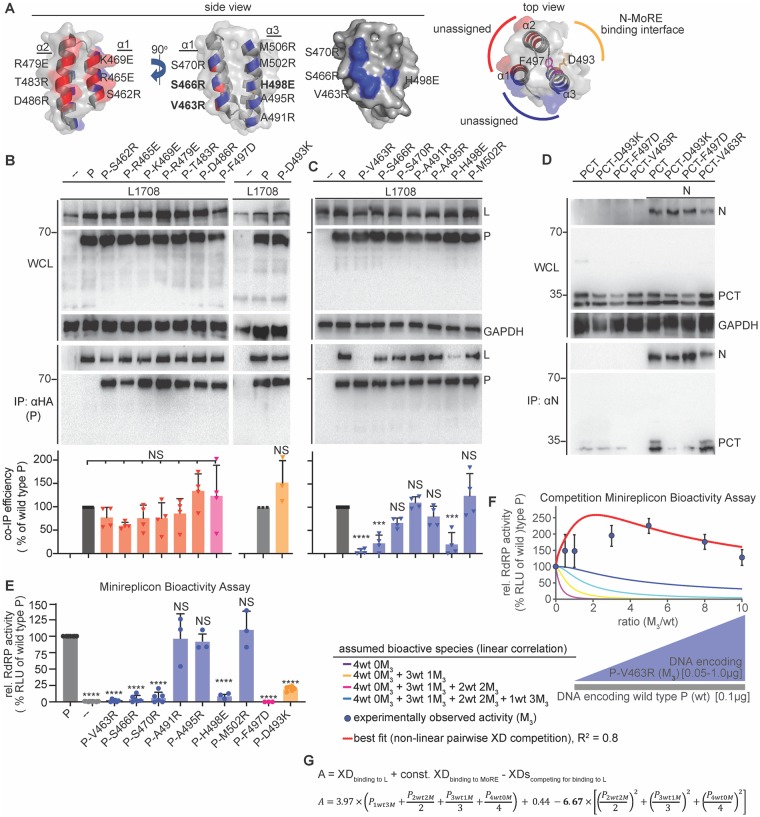
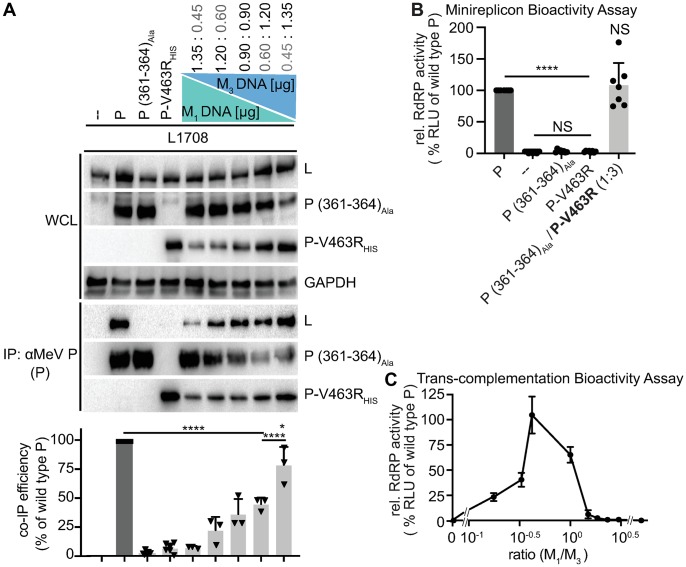
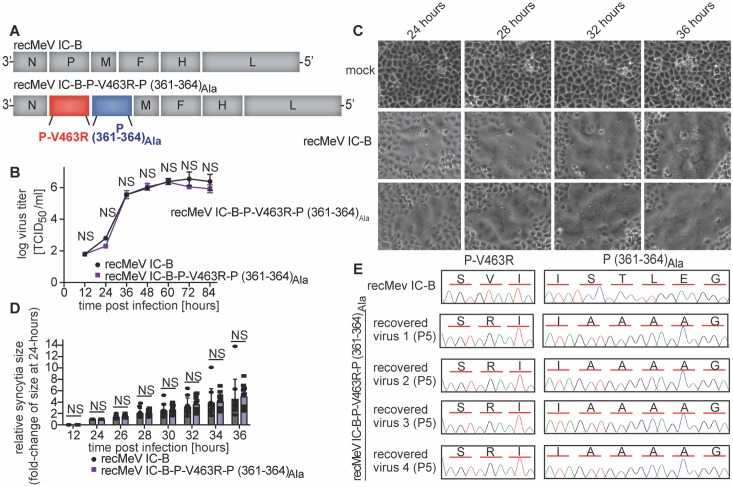
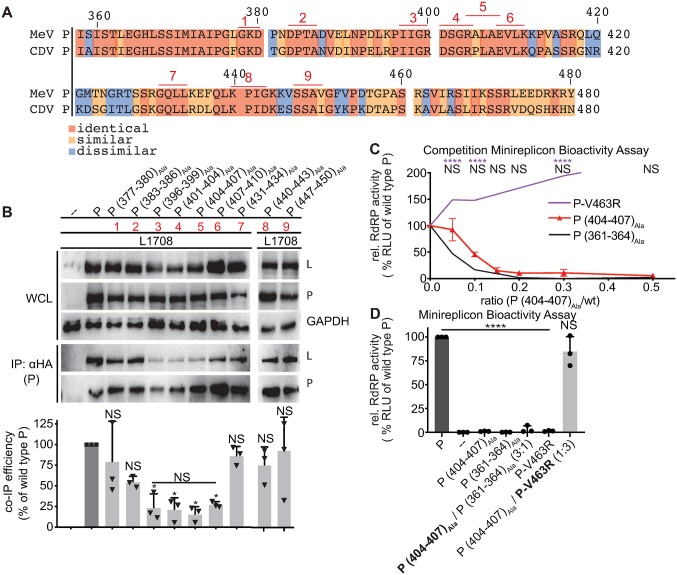
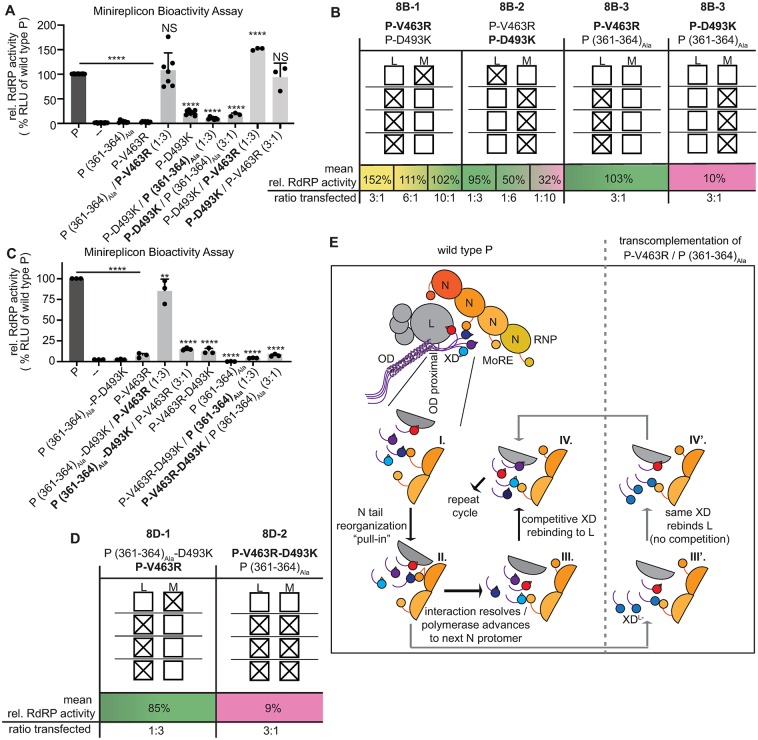
Measles virus (MeV) is a highly contagious, re-emerging, major human pathogen. Replication requires a viral RNA-dependent RNA polymerase (RdRP) consisting of the large (L) polymerase protein complexed with the homo-tetrameric phosphoprotein (P). In addition, P mediates interaction with the nucleoprotein (N)-encapsidated viral RNA genome. The nature of the P:L interface and RdRP negotiation of the ribonucleoprotein template are poorly understood. Based on biochemical interface mapping, swapping of the central P tetramerization domain (OD) for yeast GCN4, and functional assays, we demonstrate that the MeV P-to-L interface is bipartite, comprising a coiled-coil microdomain proximal to the OD and an unoccupied face of the triangular prism-shaped C-terminal P X-domain (P-XD), which is distinct from the known P-XD face that binds N-tail. Mixed null-mutant P tetramers regained L-binding competence in a ratio-dependent manner and fully reclaimed bioactivity in minireplicon assays and recombinant MeV, demonstrating that the individual L-binding interface elements are physically and mechanistically distinct. P-XD binding competence to L and N was likewise trans-complementable, which, combined with mathematical modeling, enabled the mechanistic characterization of P through two- and stoichiometrically-controlled three-way complementations. Only one each of the four XDs per P tetramer must be L or N binding-competent for bioactivity, but interaction of the same P-XD with L and N was mutually exclusive, and L binding superseded engaging N. Mixed P tetramers with a single, designated L binding-competent P-XD caused significant RdRP hyperactivity, outlining a model of iterative resolution and reformation of the P-XD:L interface regulating polymerase mobility.


Conflict of interest statement

The authors have declared that no competing interests exist.

Figures

Fig 1
Fig 1. P OD C-terminal microdomain is required for P-to-L binding.
A) Overview of proposed L binding domains on P for different Paramyxoviridae. Numbering refers to MeV P. B) Schematic representation of P with OD deletion or exchange with yeast GCN4. C) Immunoblots of whole cell lysates (WCL) and immunoprecipitates (IP) after co-transfection with L1708 (L) and P variants shown in (B). P was detected with anti-HA antibodies, L with anti-FLAG antibodies. GAPDH served as loading control. Graph shows relative co-IP efficiency of L with P; columns are means ± SD, symbols show individual biological repeats (n >= 3). D) Native PAGE analysis of P constructs shown in (B). Trimeric and dimeric variants of yeast GCN4 (P-GCN4Trimeric and P-GCN4Dimeric, respectively) were included for mobility reference. SDS-PAGE shows immunoblots of the identical samples after denaturation and reduction. E) P-L co-IP of alanine scanning mutagenesis of the P (361–377) microdomain. F) Monocistronic minireplicon assay performed in the presence of wild type P or P mutants specified. Columns are means ± SD, symbols show individual biological repeats (n = 3). All statistical analyses through one-way ANOVA with Tukey’s post hoc multiple comparison test. (NS, not significant; **, p ≤ 0.01; ****: p ≤ 0.0001).
Fig 2
Fig 2. P (361–364)Ala acts on RdRP bioactivity in a dominant-negative manner.
A) Alignment of P residues 361–377 of selected morbilliviruses. Predicted a and d positions of heptad repeat motif are highlighted. B) P:L interaction analysis of P mutants with alanine substitutions at positions 361–364. Detection and quantitative analysis as in Fig 1C (n ≥ 3). C) Minireplicon assay with P alanine substitutions at positions 361–364 (n = 3). D) Schematic of mixed P tetramer species present after co-expression of P (361–364)Ala (M1) and wild type P (wt). Equations specify the probability of formation for each tetramer species, and the graph shows the relative proportion of these species in co-transfected cells as a function of wild type and mutant input plasmid ratio, graphically represented below the x-axis. E) Observed RdRP activity in minireplicon assays in the presence of different P (361–364)Ala and wt P ratios as depicted in (D). Symbols show means of experimentally observed biological repeats ± SD (n = 3). Solid lines represent activity curve predictions according to a linear combination model and the relative distributions of the P tetramer species shown in (D). The dotted line represents the best fit curve of the experimental data with weight assignments specified in the equation (A, relative RdRP activity), goodness of fit (R2) is indicated. All statistical analyses and symbols as detailed in Fig 1.
Fig 3
Fig 3. P-XD is essential for efficient P:L interaction, but P-XD deletion mutants lack cooperative negative impact on RdRP activity.
A) Schematic of P mutants generated with C-terminal truncations. B, C) P:L interaction analysis of P mutants shown in (A) and P-XD expressed in isolation (P-XD) or as a GST fusion protein (GST-P-XD). Detection and quantitative analysis as in Fig 1C (n ≥4 (B) and n = 3 (C)). D) Observed RdRP activity in minireplicon assays in the presence of different PΔXD (M2) and wt P ratios as graphically depicted below the graph. Symbols with connecting line represent means of experimentally observed biological repeats ± SD (n = 3). Solid lines represent activity curve predictions according to a linear combination model as in Fig 2E. All statistical analyses and symbols as detailed in Fig 1 (*, p ≤ 0.05).
Fig 4
Fig 4. Identification of a specific L-binding face of the triangular prism fold of P-XD with regulatory effect on RdRP bioactivity.
A) Structural representations of MeV P-XD (PDB: 1T6O; only the P-XD component is represented), shown in side and top views. Areas between helices α1/α2 (red) and α1/α3 (blue) form faces of the prism without known interaction partners or bioactivities. Specific residues on each face are specified. Top view shows the known MoRE-binding face of P-XD between helices α2/α3 (yellow), residues confirmed (F497) or predicted (D493) to respectively impair P-XD fold or MoRE binding when mutated are highlighted. Grey background represents space-fill surface model. B, C) P:L interaction analysis of P mutants with individual substitutions of residues specified in (A), forming the “red” and “blue” prism surfaces or implicated in MoRE binding (yellow). Detection and quantitative analysis as in Fig 1C (n = 4 (B); n = 3 (C)). D) PCT:N interaction after mutation of residue D493 on the MoRE interaction face of P-XD. Anti-N antibodies were used for IPs and anti-HA to detect PCT variants. E) Minireplicon analysis of RdRP activity in the presence of the specified P mutants. Columns represent means of experimentally observed values ± SD, symbols show individual biological repeats (n ≥ 3). F) Observed RdRP activity in minireplicon assays in the presence of different P-V463R (M3) and wt P ratios as graphically depicted below the graph. Symbols show means of experimentally observed biological repeats ± SD (n = 3). Solid lines represent activity curve predictions according to a linear combination model as in Fig 2E. The dotted line (red) represents the best fit curve of the experimental data based on a non-linear pairwise P-XD competition model, goodness of fit (R2) is indicated. G) Mathematical description of the model represented in (E). P-XD bioactivities considered and the corresponding weight assignments are specified. All statistical analyses and symbols as detailed in Fig 1 (***, p ≤ 0.001).
Fig 5
Fig 5. L-binding null-mutants in P OD C-terminal microdomain and P-XD efficiently trans-complement.
A) Graphic depiction of P (361–364)Ala / P-V463R trans-complementation ratios tested and P:L interaction analysis of the different trans-complementation pairs. A HIS-tagged version of the P-V463D mutant was used to enable differential immunoprecipitation, detection and quantitative analysis otherwise as in Fig 1C (n ≥ 3). B) Minireplicon assay of candidate trans-complementation P mutants alone and co-expressed at 1:3 relative ratio (n ≥ 3). C) Trans-complementation RdRP activity profile of the pair shown in (A) and (B), analyzed in minireplicon assays over the specified relative ratio range. Symbols show means of biological repeats ± SD (n = 3). All statistical analyses and symbols as detailed in Fig 1.
Fig 6
Fig 6
A) Graphic genome representations of standard MeV (strain IC-B) and trans-complementation candidate. The relative positions of the P-V463R (red) and P (361–364)Ala (blue) genes are highlighted. B) Viral growth curves after recovery of parent recMeV IC-B and trans-complemented recMeV IC-B P-V463R-P (361–364)Ala. Symbols represent mean titers of biological repeats ± SD (n = 3). Statistical analysis through two-way ANOVA with Sidak’s post-hoc comparison tests. C) Microphotograph time-courses of uninfected Vero-hSLAM cells (mock) or cells infected with recMeV IC-B or recMeV IC-B P-V463R-P (361–364)Ala, taken in 4-hour intervals from 24–36 hours after infection. Each series shows a specific area, monitored over time. D) Quantitation of CPE kinetics after infection of cells with standard and trans-complemented recMeV. Syncytia sizes in 10 distinct areas/virus were quantitated automatically using a high-content imager, and are each expressed as fold-change increase in syncytia size (in μm2 area covered) relative to syncytia size at the same plate coordinates at 24 hours pI. Columns represent means of experimentally observed values ± SD, symbols show individual repeats (n = 10); NS not significant. E) Chromatograms of P sequences at mutated areas of recovered recMeV IC-B and recMeV IC-B P-V463R-P (361–364)Ala after five serial passages on Vero-hSLAM cells. Encoded amino acids are specified above the chromatograms.
Fig 7
Fig 7. Residues in the connector region between P position 377 and 458 trans-complement P-XD mutations but are functionally linked to the OD C-terminal microdomain.
A) Alignment of MeV and CDV P sequences between residues 358 and 480. Conserved patches (≥3 identical residues) are underlined and numbered consecutively. B) P:L interaction analysis of P mutants with alanine substitutions of residues in conserved patches identified in (A; red numbers). Detection and quantitative analysis as in Fig 1C (n = 3). C) Minireplicon competition experiment between P (404–407)Ala and wt P, set-up as in Fig 2D and 2E. Symbols show means of relative RdRP activity ± SD, three biological repeats. Purple and black lines show competition profiles respectively between P-V463R (Fig 4G) and P (361–364)Ala (Fig 2E). Statistical analysis with two-way ANOVA and Sidak’s post-hoc multiple comparison test. D) Trans-complementation minireplicon assays of P (404–407)Ala with P (361–364)Ala and P-V463R, respectively, relative ratios of P-encoding plasmid DNA transfected as specified. Columns represent mean relative RdRP activities ± SD, symbols show biological repeats (n = 3). Statistical analyses in (B) and (D) and symbols as in Fig 1.
Fig 8
Fig 8. 2-way and 3-way trans-complementations to probe stoichiometric requirements of the different P-XD functionalities in bioactive RdRP complexes.
A, C) Trans-complementation minireplicon assays of P single and double mutants as specified. Relative ratios of P-encoding plasmid DNA transfected are indicated. Columns represent mean relative RdRP activities, symbols show individual biological repeats ± SD (n ≥ 3). Statistical analyses through one-way ANOVA and Tukey’s multiple comparison test, symbols as detailed in Fig 1. B, D) Schematic overview of the predominant P tetramer populations of selected trans-complementation pairs from (A) and (C) as specified. P-encoding plasmid DNA ratios transfected are indicated and mean relative RdRP activities are color-coded (green, wild type P-like activity; yellow, hyper-active; magenta, inactive). Boxes represent dominant XDs composition of trans-complemented mixed P tetramers. Open boxes indicate L (L) or MoRE (M) binding-competence, crossed boxes denote the presence of loss-of-function substitutions for the respective binding activity. E) Mechanistic summary model of P interaction with L and P-XD-mediated regulation of RdRP negotiation of the N-encapsidated template. Individual XDs of the P tetramer are differentiated by color, Ncore and MoREs are shown in orange. Roman numerals in close-up inserts depict specific interactions identified through trans-complementations and are discussed in the text. A model for RdRP activity boosting by the signature trans-complementation pair P-V463R / P (361–364)Ala is shown on the right.

Similar articles

Cited by

References

    1. Gutsche I, Desfosses A, Effantin G, Ling WL, Haupt M, Ruigrok RWH, et al. Near-atomic cryo-EM structure of the helical measles virus nucleocapsid. Science. 2015;348(6235):704–7. 10.1126/science.aaa5137 - DOI - PubMed
    1. Morin B, Kranzusch PJ, Rahmeh AA, Whelan SP. The polymerase of negative-stranded RNA viruses. Curr Opin Virol. 2013;3(2):103–10. Epub 2013/04/23. 10.1016/j.coviro.2013.03.008 . - DOI - PMC - PubMed
    1. Horikami SM, Smallwood S, Bankamp B, Moyer SA. An Amino-Proximal Domain of the L-Protein Binds to the P-Protein in the Measles-Virus Rna-Polymerase Complex. Virology. 1994;205(2):540–5. 10.1006/viro.1994.1676 - DOI - PubMed
    1. Holmes DE, Moyer SA. The phosphoprotein (P) binding site resides in the n terminus of the L polymerase subunit of Sendai virus. J Virol. 2002;76(6):3078–83. 10.1128/JVI.76.6.3078-3083.2002 - DOI - PMC - PubMed
    1. Bloyet LM, Brunel J, Dosnon M, Hamon V, Erales J, Gruet A, et al. Modulation of Re-initiation of Measles Virus Transcription at Intergenic Regions by P-XD to N-TAIL Binding Strength. Plos Pathog. 2016;12(12). ARTN e1006058. 10.1371/journal.ppat.1006058 - DOI - PMC - PubMed

Publication types

Substances