. 2019 Aug 5;15(8):e1007963.
doi: 10.1371/journal.ppat.1007963. eCollection 2019 Aug.

The alpha-1 subunit of the Na+,K+-ATPase (ATP1A1) is required for macropinocytic entry of respiratory syncytial virus (RSV) in human respiratory epithelial cells

Affiliations

The alpha-1 subunit of the Na+,K+-ATPase (ATP1A1) is required for macropinocytic entry of respiratory syncytial virus (RSV) in human respiratory epithelial cells

Matthias Lingemann et al. PLoS Pathog. .

Abstract

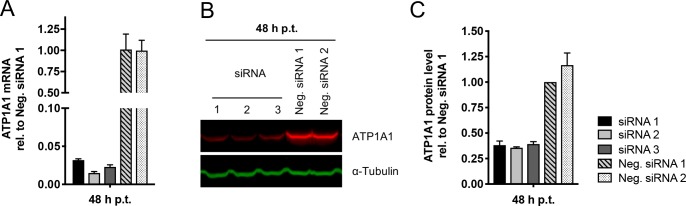
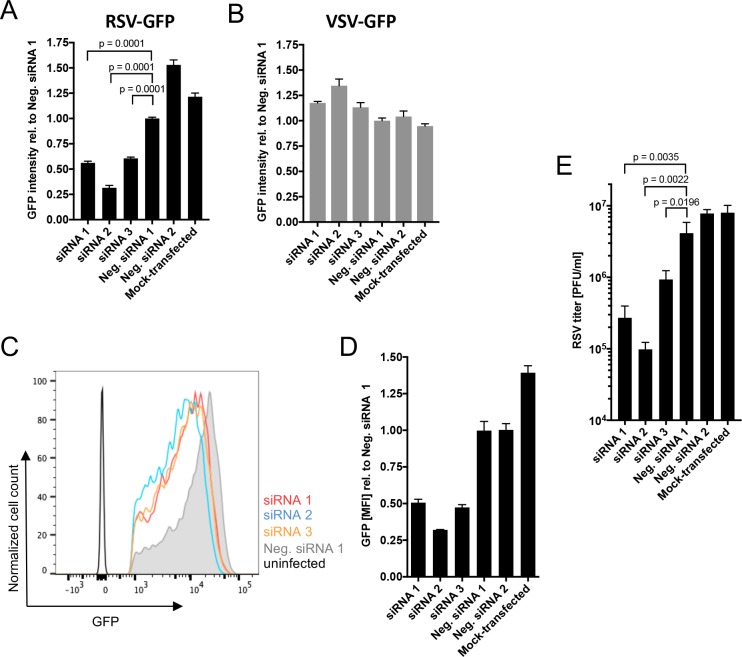
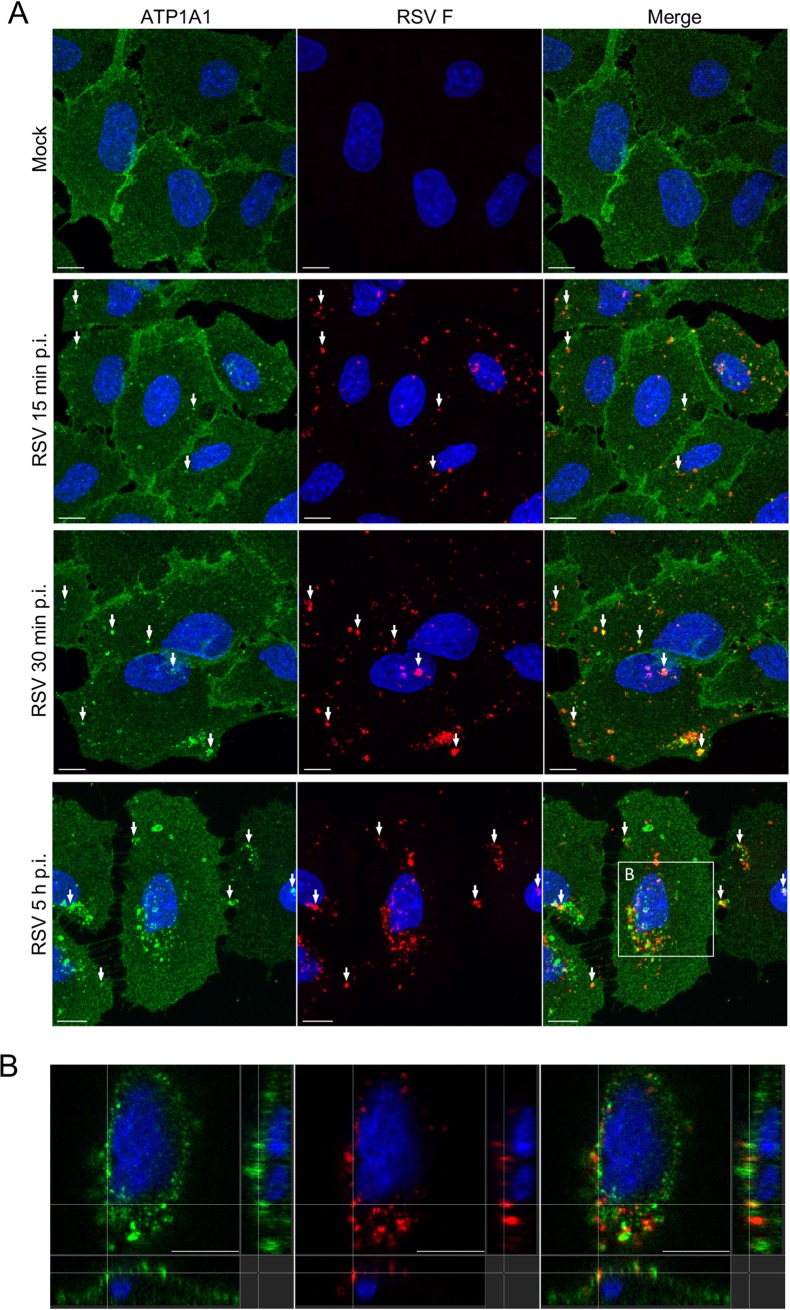
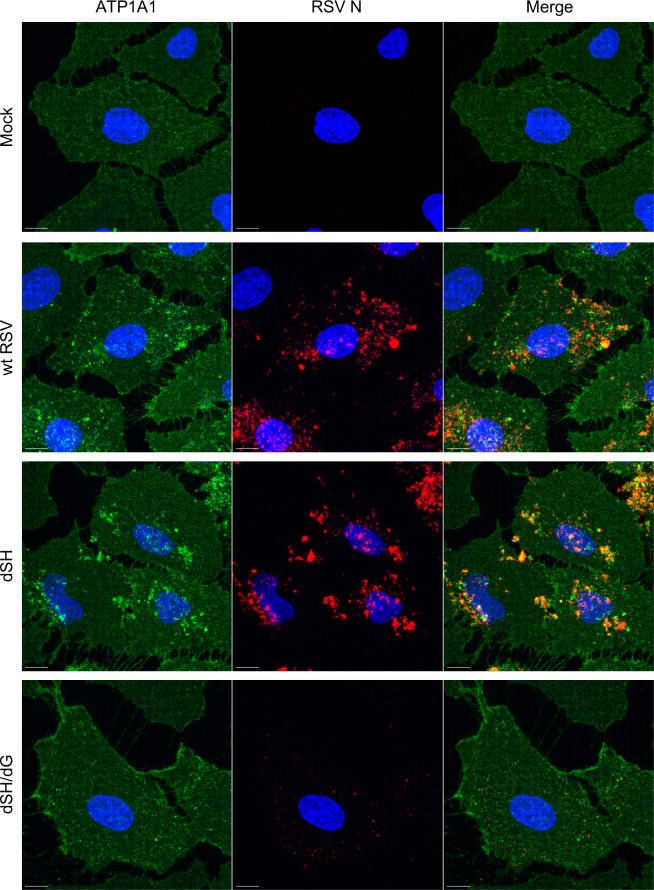
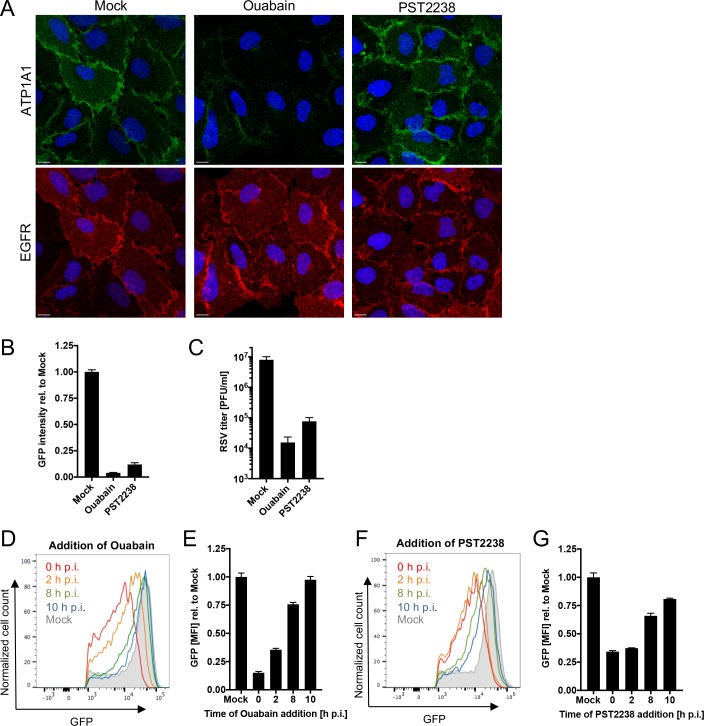
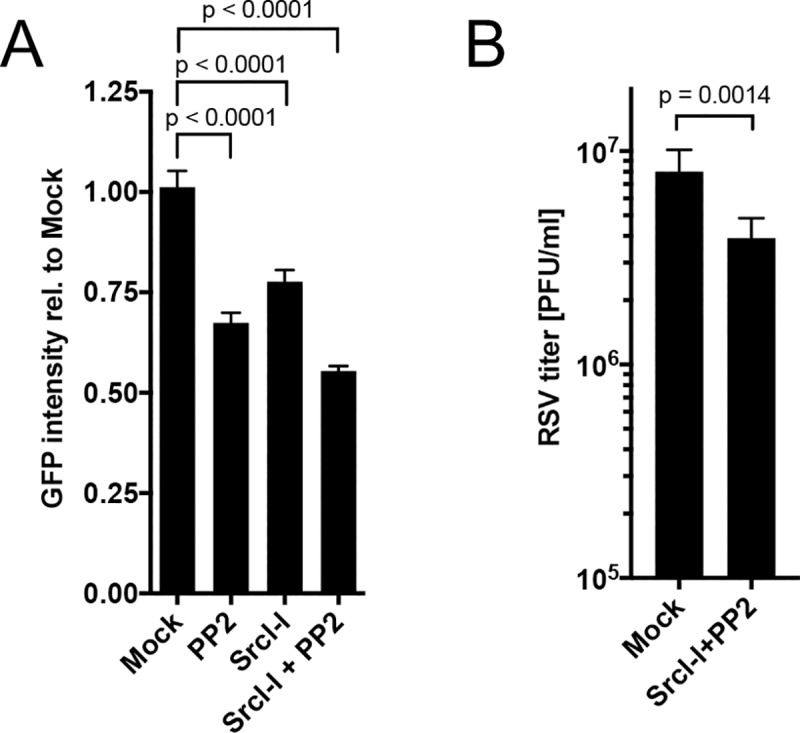
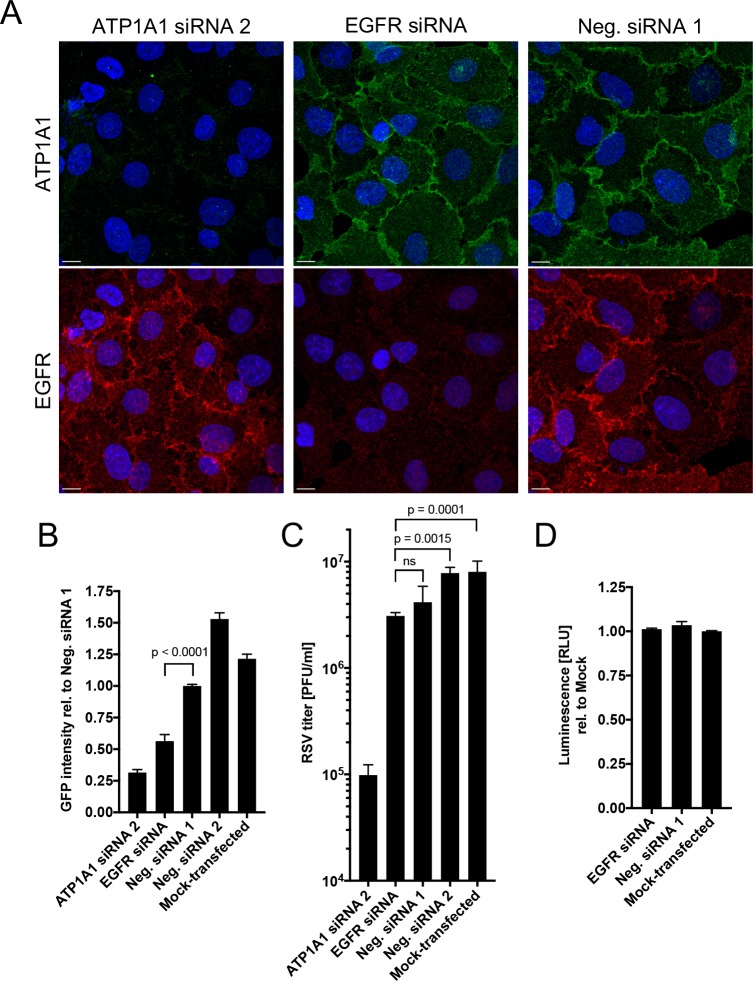
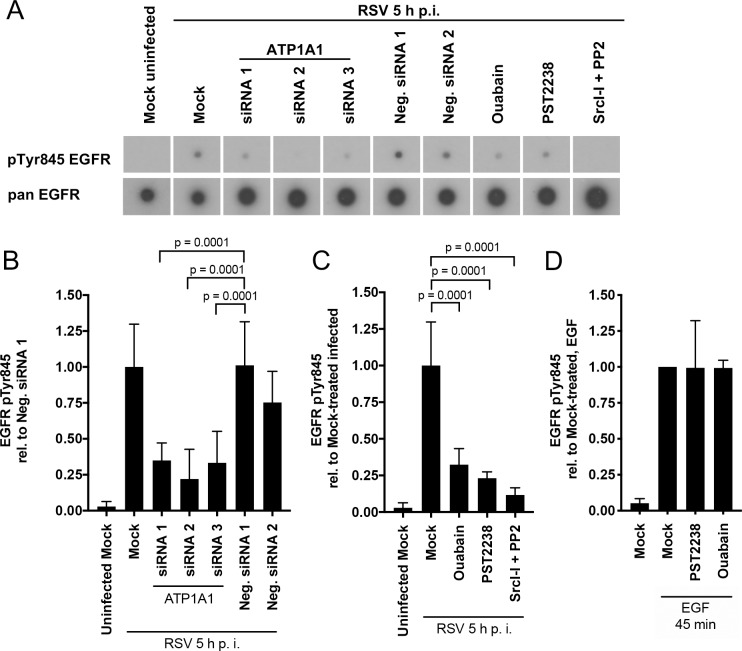
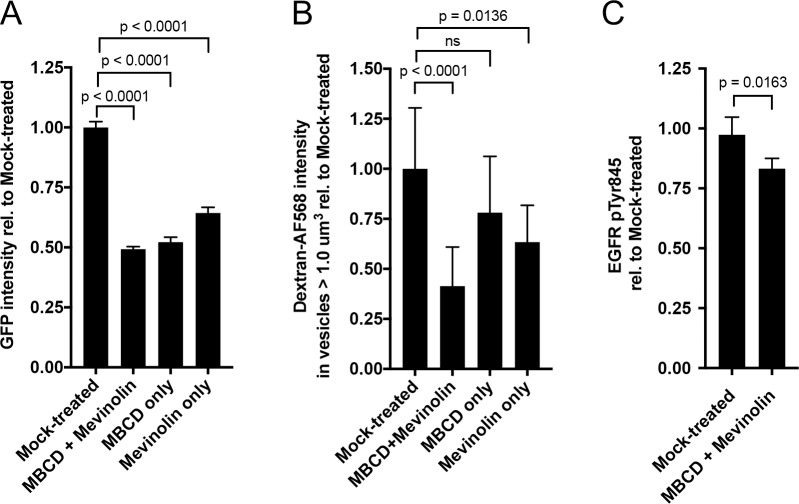
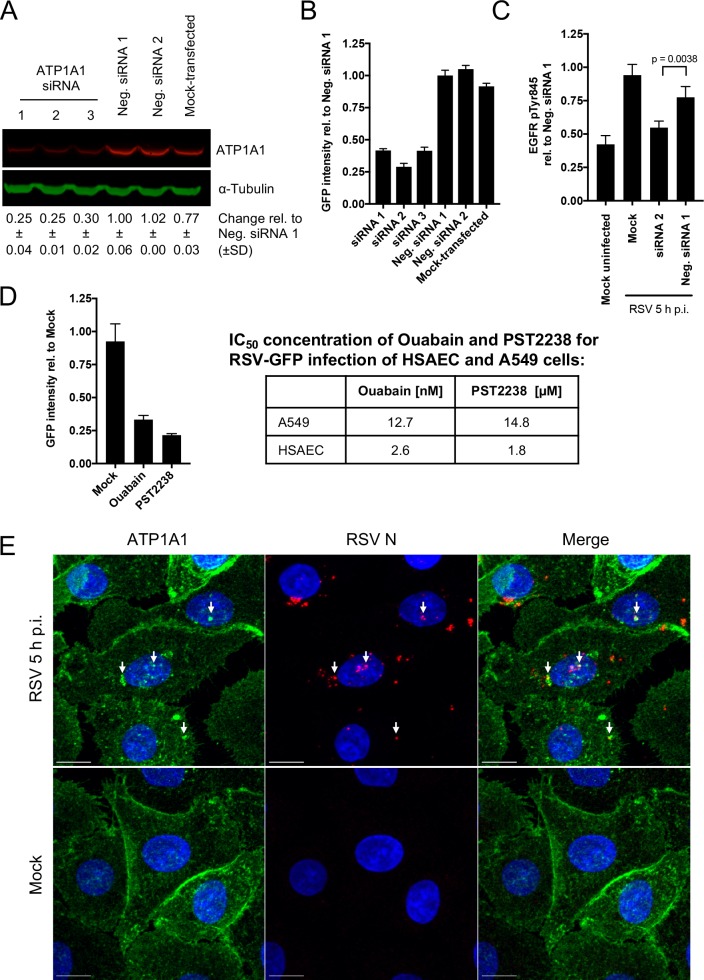
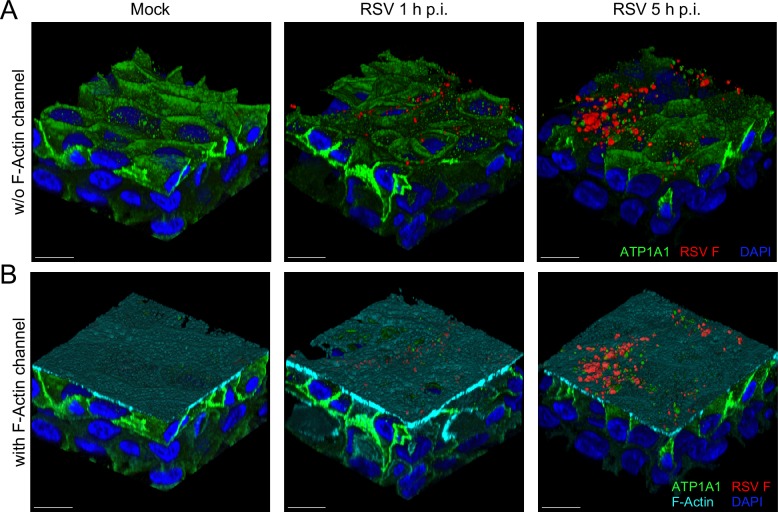
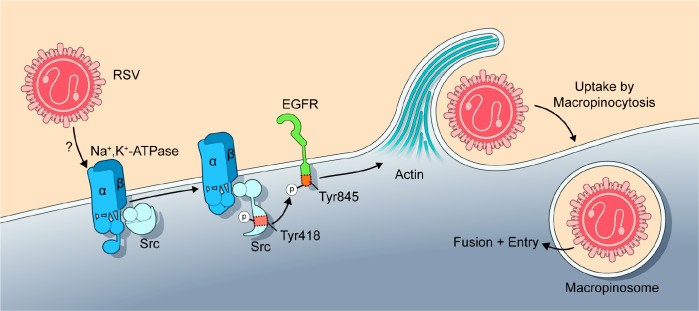
Human respiratory syncytial virus (RSV) is the leading viral cause of acute pediatric lower respiratory tract infections worldwide, with no available vaccine or effective antiviral drug. To gain insight into virus-host interactions, we performed a genome-wide siRNA screen. The expression of over 20,000 cellular genes was individually knocked down in human airway epithelial A549 cells, followed by infection with RSV expressing green fluorescent protein (GFP). Knockdown of expression of the cellular ATP1A1 protein, which is the major subunit of the Na+,K+-ATPase of the plasma membrane, had one of the strongest inhibitory effects on GFP expression and viral titer. Inhibition was not observed for vesicular stomatitis virus, indicating that it was RSV-specific rather than a general effect. ATP1A1 formed clusters in the plasma membrane very early following RSV infection, which was independent of replication but dependent on the attachment glycoprotein G. RSV also triggered activation of ATP1A1, resulting in signaling by c-Src-kinase activity that transactivated epidermal growth factor receptor (EGFR) by Tyr845 phosphorylation. ATP1A1 signaling and activation of both c-Src and EGFR were found to be required for efficient RSV uptake. Signaling events downstream of EGFR culminated in the formation of macropinosomes. There was extensive uptake of RSV virions into macropinosomes at the beginning of infection, suggesting that this is a major route of RSV uptake, with fusion presumably occurring in the macropinosomes rather than at the plasma membrane. Important findings were validated in primary human small airway epithelial cells (HSAEC). In A549 cells and HSAEC, RSV uptake could be inhibited by the cardiotonic steroid ouabain and the digitoxigenin derivative PST2238 (rostafuroxin) that bind specifically to the ATP1A1 extracellular domain and block RSV-triggered EGFR Tyr845 phosphorylation. In conclusion, we identified ATP1A1 as a host protein essential for macropinocytic entry of RSV into respiratory epithelial cells, and identified PST2238 as a potential anti-RSV drug.


Conflict of interest statement

M.L., P.L.C. and S.M. are coinventors on a patent application for the development of PST2238 (rostafuroxin) as an antiviral drug.

Figures

Fig 1
Fig 1. ATP1A1 knock down by siRNA transfection.
A549 cells were transfected individually with siRNAs 1, 2, and 3 targeting the ATP1A1 mRNA, as well as with scrambled negative controls Neg. siRNA 1 and 2 that have no known target in human cells. Cells were harvested 24, 48 and 72 h post transfection (p.t.) and the ATP1A1 mRNA and protein levels were quantified. (A) Relative quantification of ATP1A1 mRNA. Total RNA was isolated, reverse transcribed, and quantified by an ATP1A1-specific TaqMan Assay. Values were normalized to 18S rRNA and expressed as mean values relative to Neg. siRNA 1 assigned the value of 1.0, with error bars indicating the standard deviation of three independent experiments with three replicate reactions each. (B) Western blot analysis of ATP1A1 expression. Cells were lysed at 48 h p.t. and subjected to Western blotting with an anti-ATP1A1 rabbit monoclonal antibody (MAb) (ab76020) and a corresponding infrared dye 680RD-conjugated goat anti-rabbit secondary antibody. Alpha-tubulin was used as a loading control and was detected by an anti-alpha-tubulin mouse MAb and an infrared dye 800CW-conjugated goat anti-mouse secondary antibody. A representative blot is shown. (C) Quantification of ATP1A1 Western blots. Western blot analyses of three independent experiments, as described in Part B, were quantified, normalized to alpha-tubulin, and reported relative to Neg. siRNA 1 assigned the value of 1.0, with error bars indicating the standard deviation.
Fig 2
Fig 2
Effect of ATP1A1 knockdown on infection by RSV-GFP (A, C, D) and VSV-GFP (B). A549 cells were transfected with the indicated siRNAs and 48 h later were infected with 1 PFU/cell RSV-GFP (A, C, D) or 0.5 PFU/cell VSV-GFP (B). (A and B) Effects on RSV and VSV. Following infection with RSV-GFP (A) or VSV-GFP (B), the cells were incubated for 17 h, and the GFP intensity of the total area of each well of A549 cells was quantified by scanning with an ELISA reader and is expressed relative to cells infected with the same virus for which the transfected siRNA was Neg. siRNA 1. (C and D) Flow cytometry analysis of RSV-GFP expression. Following infection with RSV-GFP, the cells were incubated for 24 h, and GFP expression of single, live, GFP+ cells was quantified by flow cytometry, with cells from an untransfected, uninfected well included for reference. The plot (C) shows cell count versus GFP intensity, and the histogram (D) shows GFP MFI relative to cells infected with the same virus for which the transfected siRNA was Neg. siRNA 1. (E) Titer of progeny RSV-GFP. Following infection with RSV-GFP (MOI = 1 PFU/cell), the cells were incubated for 24 h, and the cells and media were harvested together (Materials and Methods) and the yield of RSV-GFP was determined by plaque titration on Vero cells. All data in A-D are derived from at least three independent experiments and shown as mean values with error bars indicating the standard deviation. The statistical significance of difference was determined by one-way analysis of variance with Dunnett’s multiple comparison post-test and p-values are shown for each comparison.
Fig 3
Fig 3. RSV infection triggers ATP1A1 clustering.
(A) A549 cells were inoculated with wt RSV (MOI = 5 PFU/cell). Cells were fixed at different time points p.i. with 4% PFA, permeabilized with 0.1% TritonX-100 and stained for ATP1A1 (green) with an anti-ATP1A1 MAb (ab76020) and AF488-conjugated donkey anti-rabbit secondary antibody. RSV F (red) was detected with anti-RSV F mouse MAb #1129 [72] and an AF594-conjugated anti-mouse secondary antibody. The cell nuclei were stained with DAPI (blue). Images (z-stacks) were acquired on a Leica SP5 confocal microscope, with a 63x objective (NA 1.4) and a zoom of 3.0. Arrows indicate examples of co-localization of ATP1A1 and RSV F. Scale bar 10 μm. (B) Cross section of the marked area of the RSV 5 h p.i. image of Fig 3A. The entire cross-section in ZY-view of this image is shown in S1 Movie. Scale bar 10 μm.
Fig 4
Fig 4. RSV G is required for ATP1A1 clustering.
A549 cells were inoculated with wt RSV, rgRSV-dSH or rgRSV-dSH/dG (MOI = 10 PFU/cell) and incubated for 5 h. Cells were fixed with 4% PFA and subjected to immunofluorescence staining, as described for Fig 3. ATP1A1 (green) was detected by an anti-ATP1A1 rabbit MAb (ab76020) and AF568-conjugated donkey anti-rabbit secondary antibody. RSV N (red) was detected by an anti-RSV N mouse MAb (ab94806) and an AF647-conjugated donkey anti-mouse secondary antibody. The cell nuclei were stained with DAPI (blue). Images (z-stacks) were acquired on a Leica SP8 confocal microscope, with a 63x objective (NA 1.4) and a zoom of 3.0. Scale bar 10 μm.
Fig 5
Fig 5. Effect of ouabain and PST2238 on RSV infection.
(A) ATP1A1 and EGFR expression in A549 cells treated with Ouabain or PST2238. Uninfected A549 cells were treated for 24 h with either 25 nM ouabain or 20 μM PST2238 and subjected to an immunofluorescence staining. ATP1A1 (green) was detected by an anti-ATP1A1 rabbit MAb (ab76020) and an AF488-conjugated donkey anti-rabbit secondary antibody. EGFR (red) was detected by an anti-EGFR rat MAb (ab231) and an AF647-conjugated goat anti-rat secondary antibody. The cell nuclei were stained with DAPI (blue). Scale bar 10 μm. (B and C) Inhibitory effect on RSV infection. A549 cells pre-treated for 16 h with either 25 nM ouabain or 20 μM PST2238 were inoculated with RSV-GFP (MOI = 1 PFU/cell). Cells were incubated for 17 h and infectivity was quantified by: (B) GFP signal of the total well, scanned by an ELISA reader and reported relative to mock-treated infected cells as 1.0; and (C) virus titer determined by plaque titration on Vero cells 24 h p.i. (D—G) Time-of-drug-addition experiment. A549 cells infected with RSV-GFP (MOI = 3 PFU/cell) were changed to medium containing 25 nM ouabain (D, E) or 20 μM PST2238 (F, G) at the indicated times post infection. Cells were harvested 24 h p.i. and GFP intensity was quantified by flow cytometry of live, single, GFP+ cells. The MFI of GFP+ cells was quantified and expressed relative to mock-treated, RSV-infected cells (E, G).
Fig 6
Fig 6. Src-kinase activity is required for infection.
A549 cells were pre-treated with non-cytotoxic concentrations of the indicated Src-kinase inhibitors (PP2 [12.5 μM], SrcI-I [6.25 μM] or both) or mock-treated (DMSO carrier control) for 5 h. Cells were then inoculated with RSV-GFP (MOI = 1 PFU/cell) in media containing the indicated inhibitors. (A) Effect of Src-kinase inhibition on RSV infection. At 17 h p.i., GFP intensity was measured with an ELISA reader and expressed relative to mock-treated infected cells assigned the value of 1.0. (B) Titer of progeny RSV-GFP. At 24 h p.i. RSV titers were determined in replicate cultures by plaque titration on Vero cells. The statistical significance of the difference was determined by one-way analysis of variance with Tukey’s multiple-comparison post-test and p-values are shown for each comparison.
Fig 7
Fig 7. Effect of EGFR knockdown on RSV infection.
(A) ATP1A1 and EGFR expression in A549 cells transfected with siRNAs targeting ATP1A1 or EGFR. A549 cells were transfected with ATP1A1 siRNA 2, EGFR siRNA, or Neg. siRNA 1 or 2, incubated for 48 h, and subjected to immunofluorescence staining for ATP1A1 (green) and EGFR (red) as described for Fig 4A. Images (z-stacks) were acquired on a Leica SP5 confocal microscope with 63x objective NA 1.4 and 2.0x zoom. Scale bar 10 μm. (B and C) EGFR knockdown reduces RSV infection and virion production. A549 cells were transfected with an EGFR-specific siRNA or Neg. siRNA 1 or 2, and 48 h later were infected with RSV-GFP (MOI = 1 PFU/cell). Infection was quantified by (B) GFP signal of the total well, scanned by ELISA reader at 17 h p.i., and RSV production was assessed by (C) plaque titration on Vero cells 24 h p.i. Data are derived from three independent experiments. The statistical significance of the difference was determined by one-way analysis of variance with Tukey’s multiple-comparison post-test and p-values of the significance for each comparison is indicated. (D) Cell viability. An ATP-based cell viability assay (CellTiter-Glo) was performed 72 h p.t. to evaluate the viability of the transfected cells. Cells were lysed, the ATP concentration was determined by luciferase activity relative to mock-transfected cells, as a measure of viability.
Fig 8
Fig 8. ATP1A1-dependent EGFR phosphorylation at Tyr845 during RSV infection.
A549 cells were treated as indicated (either siRNA knockdown for 48 h, or pre-treatment with the chemical compounds ouabain [25 nM], PST2238 [40 μM] or Src-Inhibitor-I (SrcI-I) [6.25 μM] and PP2 [12.5 μM] for 5 h pre-inoculation). Coincident with these treatments, the cells were serum starved for 16 h, and then were inoculated with wt RSV (MOI = 5 PFU/cell) and incubated for 5 h. The cells were lysed and lysates were incubated with a phospho-specific EGFR antibody array, followed by detection of bound EGFR with a biotinylated pan (i.e., universal) EGFR antibody, followed by incubation with horse radish peroxidase-conjugated streptavidin, and visualization with X-ray film (RayBiotech, Inc.). (A) X-ray film showing representative array spots of pTyr845 EGFR and its corresponding pan EGFR for each treatment. (B—D) Quantification of EGFR Tyr845 phosphorylation. pTyr845 EGFR signals of three independent experiments with two technical replicates each were quantified by scanning and normalized to the signal of the internal array positive controls and pan EGFR. (B) shows the siRNA knockdown samples reported relative to Neg. siRNA 1-transfected, RSV-infected samples, and (C) shows the chemical-treated samples reported relative to mock-treated, RSV-infected samples. (D) As control, PST2238 or Ouabain pretreated A549 cells were stimulated with EGF (100 ng/ml) for 45 min and the pTyr845 EGFR signal was quantified. The statistical significance of the differences were determined by one-way analysis of variance with Dunnett multiple-comparison test and the p-values are indicated for each comparison.
Fig 9
Fig 9. RSV induces and is taken up by ATP1A1-dependent macropinocytosis, which can be blocked by ouabain or PST2238.
Macropinocytosis was assayed by monitoring the uptake of dextran (10,000 MW) conjugated to AF568 (dextran-AF568). All incubations with dextran-AF568 were preceded by serum-starvation for 16 h. (A) RSV induces macropinocytosis. A549 cells were mock-infected or infected with wt RSV (MOI = 5 PFU/cell) in medium containing dextran-AF568 (cyan). At 5 h p.i., cells were fixed with 4% PFA and nuclei counterstained with DAPI (blue), and imaged on a Leica SP5 confocal microscope with a 40x Objective NA 1.3 and 2.0x zoom. (B) Co-localization of ATP1A1, RSV N, and dextran-AF568 in RSV-infected A549 cells. Cells were infected with RSV in the presence of dextran-AF568 as described above, incubated for 5 h, fixed with 4% PFA, permeabilized with 0.1% Triton X-100, subjected to immunofluorescence staining with an anti-ATP1A1 rabbit MAb (ab76020) and an anti-RSV-N mouse MAb (ab94806), followed by AF488-conjugated goat anti-rabbit and AF647-conjugated goat anti-mouse secondary antibodies. Z-stacks were acquired on Leica SP8 confocal microscope with 63x objective, NA 1.4 and 3.0x zoom. Arrows indicate co-localization of ATP1A1 (green) and RSV N (red) in dextran-AF568-positive (cyan) vesicles. (C) Co-localization of RSV F and RSV N with dextran-AF568 in RSV-infected A549 cells. Cells were infected with RSV in the presence of dextran-AF568, incubated for 5 h, fixed, and permeabilized as described in B. The cells were then subjected to immunostaining: RSV F was detected with AF488-conjugated anti-RSV F MAb #1129 [72], and RSV N was detected with an allophycocyanin (APC)-conjugated anti-RSV N MAb (NB100-64752APC, Novus Biologicals, LLC). Image acquisition and analysis were performed as described above for B. Arrows indicate RSV F (green) and RSV N (red) in dextran-AF568-positive (cyan) vesicles. All scale bars are 10 μm. (D–F) Quantification of dextran-AF568 uptake during RSV infection. (D) A549 cells were transfected with ATP1A1 siRNA2 or Neg. siRNA 1, incubated for 48 h p.t., and inoculated with wt RSV in dextran-AF568-containing medium, or (E) A549 cells were pre-treated with ouabain or PST2238 for 16 h and inoculated with wt RSV in dextran-AF568-containing medium, or (F) A549 cells were infected with wt RSV or rgRSV dSH/dG in dextran-AF568-containing medium. For all treatments (D-F) cells were fixed 5 h p.i., counterstained with DAPI and z-stacks were acquired on a Leica SP8 confocal microscope with 63x objective NA 1.4, 1.0x zoom. For each treatment, the uptake of dextran-AF568 in vesicles greater than 1.0 μm3 was quantified as described in detail in the Materials and Methods section. Mean values are reported relative to RSV-infected cells transfected with Neg. siRNA 1 (D), or mock-treated infected cells (E), or wt RSV-infected cells (F). Error bars indicate the standard deviation of at least three independent experiments. The statistical significance of difference was determined for (D) and (E) by one-way analysis of variance with Tukey’s multiple comparison post-test and for (F) by a two-tailed unpaired t-test. P-values are shown for each comparison.
Fig 10
Fig 10. Effect of cholesterol depletion on RSV infection.
A549 cells were cholesterol-depleted by treatment with methyl-beta-cyclodextrin (MBCD) and Mevinolin or each chemical separately. (A) RSV infection of cholesterol-depleted A549 cells. A549 cells were pre-treated for 5 h with the indicated cholesterol-depleting compounds and infected with RSV-GFP (MOI = 1 PFU/cell) with presence of the cholesterol-depleting compounds maintained. Viral GFP expression was quantified 17 h p.i. and reported relative to mock-treated infected cells. (B) Quantification of macropinocytosis in cholesterol-depleted RSV-infected A549 cells. A549 cells were pre-treated for 16 h with the indicated cholesterol-depleting compounds in the absence of serum and infected with RSV (MOI = 5 PFU/cell) in the presence of dextran-AF568. At 5 h p.i the cells were fixed with 5% PFA and nuclei were counterstained with DAPI. The total intensity of dextran-AF568 in vesicles larger than 1.0 μm3 was quantified (Materials and Methods) and reported relative to mock-treated infected cells. The statistical significance of the differences was determined by one-way analysis of variance with Tukey’s multiple-comparison post-test and p-values are indicated (ns, not significant). (C) EGFR Tyr845 phosphorylation in cholesterol-depleted cells. A549 cells were treated with MBCD and Mevinolin for 16 h to deplete cholesterol from the plasma membrane. Cells were infected with wt RSV (MOI = 5 PFU/cell) and the phosphorylation of EGFR Tyr845 was quantified by an EGFR phosphorylation antibody array, as described in Fig 8. The level of pTyr845 was reported relative to mock-treated infected cells. The statistical significance of difference was determined by a two-tailed unpaired t-test.
Fig 11
Fig 11. Confirmation of results obtained in the A549 cell line by experiments in primary human small airway epithelial cells (HSAEC).
Experiments were performed as described for A549 cells in the Materials and Methods section and the preceding Figure legends. (A) siRNA knockdown in HSAEC using ATP1A1 siRNAs 1, 2, and 3 and Neg. siRNAs 1 and 2, analyzed 48 h p.t., by Western blot analysis as in Fig 1B. (B) Efficiency of RSV infection in HSAEC cells following knockdown of ATP1A1 expression using the indicated siRNAs, assayed by GFP quantification by ELISA reader, as in Fig 2A. (C) EGFR Tyr845 phosphorylation in HSAEC cells following knockdown of ATP1A1 expression using ATP1A1 siRNA 2, as in Fig 8. (D) Inhibition of RSV-GFP infection in HSAEC cells treated with 3.1 nM ouabain or 3.1 μM PST2238, evaluated by the expression of GFP as in Fig 5B. The IC50 values of ouabain and PST2238 for inhibiting RSV infection were 5- and 8-fold lower than for A549 cells, respectively (S3A and S3B Fig). (E) ATP1A1 clustering and colocalization with RSV N protein in HSAEC cells, in an experiment performed as in Fig 3. Scale bar 10 μm.
Fig 12
Fig 12. RSV induces ATP1A1 clustering in primary human airway epithelial-air liquid interface (HAE-ALI) cultures.
HAE-ALI cultures were inoculated with wt RSV (106 PFU/tissue), incubated for 1 or 5 h, fixed and subjected to immunofluorescence staining as described for Fig 3 (ATP1A1, green; RSV F, red; F-Actin, cyan; DAPI; blue). Images are shown without (A) and with (B) F-Actin staining. Images were deconvolved with Huygens Essential deconvolution software (Scientific Volume Imaging B.V, Hilversum, The Netherlands). Scale bars 10 μm.
Fig 13
Fig 13. Proposed model of ATP1A1-dependent macropinocytic entry of RSV.
On exposure to respiratory epithelial cells, RSV triggers the activation and clustering of ATP1A1 in the plasma membrane through an unknown mechanism. ATP1A1 then signals via phosphorylated Src-kinase and transactivates EGFR by its phosphorylation at Tyr845. Upon activation, EGFR signaling causes cytoskeletal rearrangement resulting in plasma membrane ruffling and formation of membrane extensions (reported previously [31, 33, 34]) that engulf fluid and RSV into macropinosomes. Note that RSV is taken up into the macropinosome in its enveloped state suggesting that it does not fuse at the cell surface; fusion and release of the nucleocapsid likely occurs within the internalized macropinosome.

Similar articles

Cited by

References

    1. Lozano R, Naghavi M, Foreman K, Lim S, Shibuya K, Aboyans V, et al. Global and regional mortality from 235 causes of death for 20 age groups in 1990 and 2010: a systematic analysis for the Global Burden of Disease Study 2010. Lancet. 2012;380(9859):2095–128. Epub 2012/12/19. 10.1016/S0140-6736(12)61728-0 . - DOI - PMC - PubMed
    1. Shi T, McAllister DA, O'Brien KL, Simoes EAF, Madhi SA, Gessner BD, et al. Global, regional, and national disease burden estimates of acute lower respiratory infections due to respiratory syncytial virus in young children in 2015: a systematic review and modelling study. Lancet. 2017;390(10098):946–58. Epub 2017/07/12. 10.1016/S0140-6736(17)30938-8 - DOI - PMC - PubMed
    1. Afonso CL, Amarasinghe GK, Banyai K, Bao Y, Basler CF, Bavari S, et al. Taxonomy of the order Mononegavirales: update 2016. Arch Virol. 2016;161(8):2351–60. Epub 2016/05/25. 10.1007/s00705-016-2880-1 - DOI - PMC - PubMed
    1. Collins PL, Karron RA. Respiratory Syncytial Virus and Metapneumovirus In: Knipe DM, Howley PM, Cohen JI, Griffin DE, Lamb RA, Martin MA, et al., editors. Fields virology. 1 6th ed Philadelphia: Lippincott Williams&Wilkins; 2013. p. 1086–123.
    1. Bukreyev A, Whitehead SS, Murphy BR, Collins PL. Recombinant respiratory syncytial virus from which the entire SH gene has been deleted grows efficiently in cell culture and exhibits site-specific attenuation in the respiratory tract of the mouse. J Virol. 1997;71(12):8973–82. ; PubMed Central PMCID: 230197. - PMC - PubMed

Publication types

MeSH terms