. 2019 Dec 1:328:108377.
doi: 10.1016/j.jneumeth.2019.108377. Epub 2019 Aug 2.

EEGSourceSim: A framework for realistic simulation of EEG scalp data using MRI-based forward models and biologically plausible signals and noise

Affiliations

EEGSourceSim: A framework for realistic simulation of EEG scalp data using MRI-based forward models and biologically plausible signals and noise

Elham Barzegaran et al. J Neurosci Methods. .

Abstract

Background: Electroencephalography (EEG) is widely used to investigate human brain function. Simulation studies are essential for assessing the validity of EEG analysis methods and the interpretability of results.

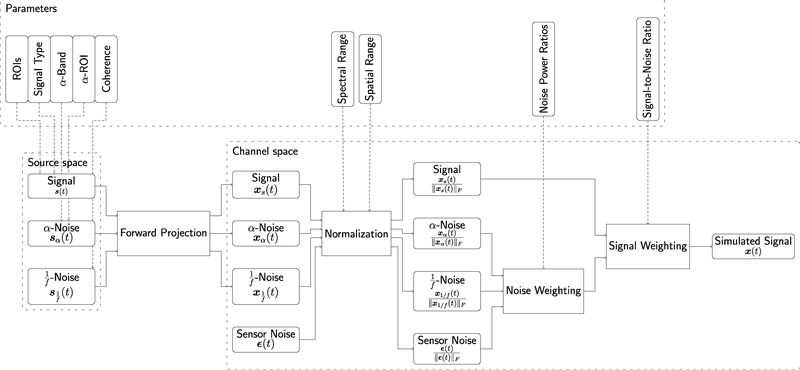
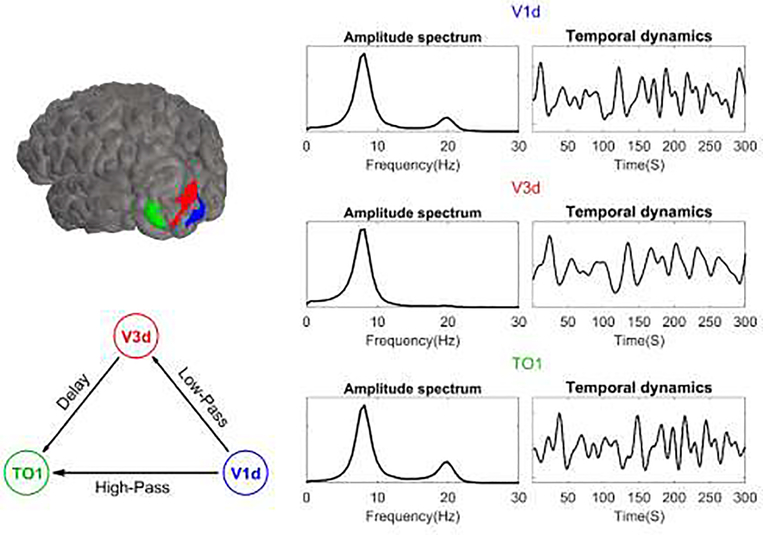
New method: Here we present a simulation environment for generating EEG data by embedding biologically plausible signal and noise into MRI-based forward models that incorporate individual-subject variability in structure and function.

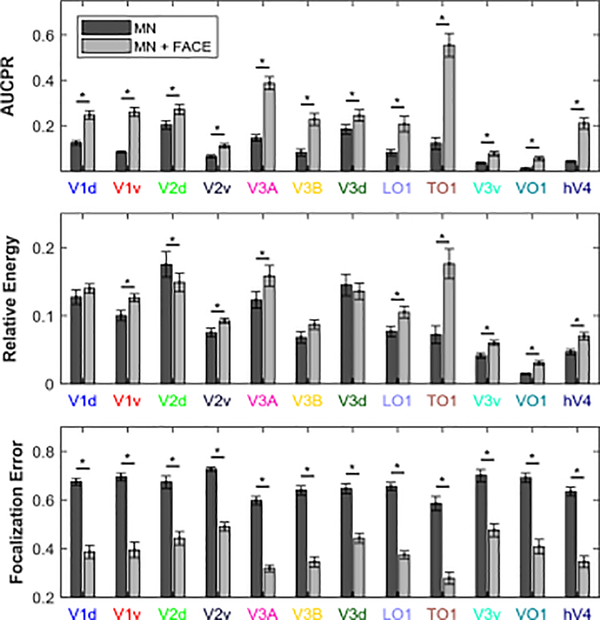
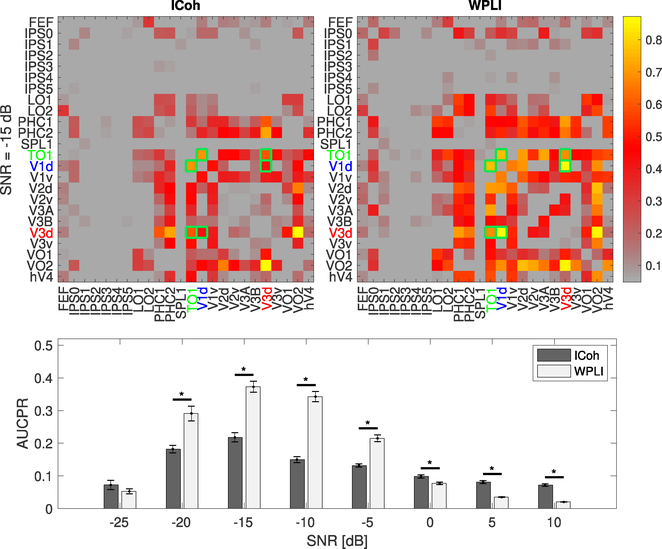
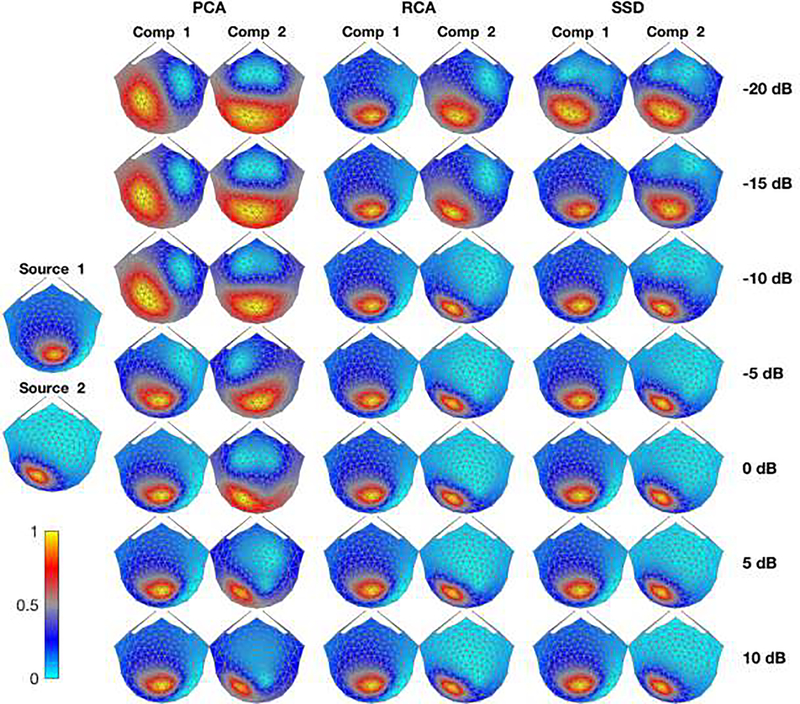
Results: The package includes pipelines for the evaluation and validation of EEG analysis tools for source estimation, functional connectivity, and spatial filtering. EEG dynamics can be simulated using realistic noise and signal models with user specifiable signal-to-noise ratio (SNR). We also provide a set of quantitative metrics tailored to source estimation, connectivity and spatial filtering applications.

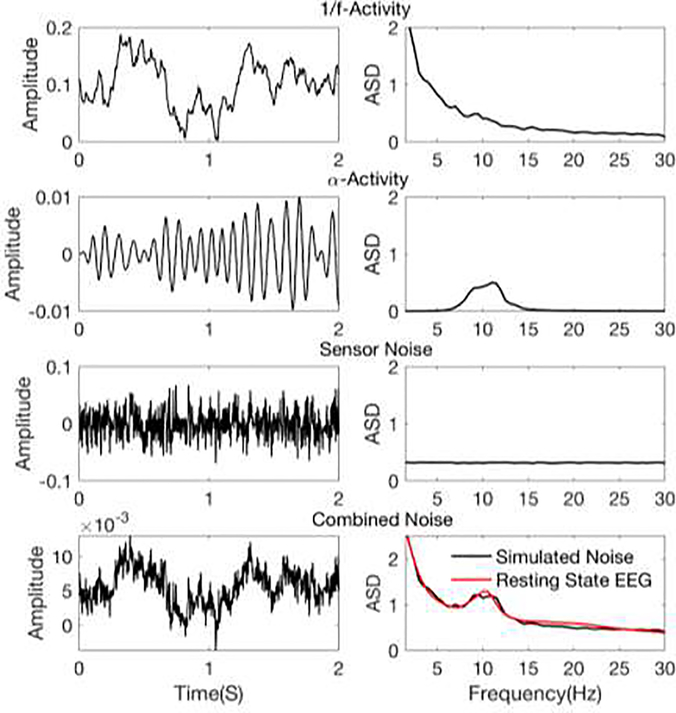
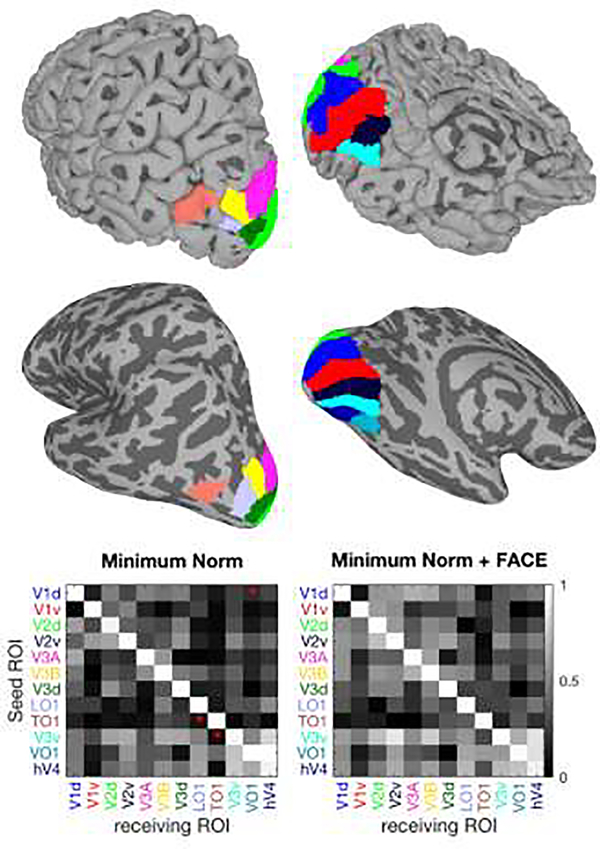
Comparison with existing method(s): We provide a larger set of forward solutions for individual MRI-based head models than has been available previously. These head models are surface-based and include two sets of regions-of-interest (ROIs) that have been brought into registration with the brain of each individual using surface-based alignment - one from a whole brain and the other from a visual cortex atlas. We derive a realistic model of noise by fitting different model components to measured resting state EEG. We also provide a set of quantitative metrics for evaluating source-localization, functional connectivity and spatial filtering methods.

Conclusions: The inclusion of a larger number of individual head-models, combined with surface-atlas based labeling of ROIs and plausible models of signal and noise, allows for simulation of EEG data with greater realism than previous packages.

Keywords: EEG simulation; Forward model; Functional connectivity; Inverse model; Regions of interest; Spatial filtering.


Figures

Figure 1.
Figure 1.
Example realizations of different noise processes. Left column: Time course of EEG noise signal from an occipital electrode (electrode 29 of EGI system). Right column: Amplitude spectral density of EEG noise signal, calculated over 30 seconds of simulated noise and averaged over all electrodes. The 1/f and α activities are projected onto channel level using the forward solution.
Figure 2.
Figure 2.
Decay of spatial coherence in dependence of spatial distance for different frequency bands.
Figure 3.
Figure 3.. EEGSourceSim pipeline overview.
The lower row of the figure indicates the main modules of the pipeline in source and channel space. The upper row of the figure indicates the parameters that the user needs to provide for each module of the pipeline.
Figure 4.
Figure 4.. Source estimation example.
The eight selected ROIs are presented in the upper two rows on uninflated (upper) and inflated (lower) left hemisphere cortical surfaces with dorsolateral (left) and ventromedial views (right). Note that the inflated surface representation was not used for simulation, but is included in order to show the full extent of all ROIs. The bottom row presents the cross-talk matrices for two inverse solutions. The ROI names are color coded according to the surface maps. The red asterisks on each of cross-talk matrices, indicate which solution has significantly lower cross-talk compared to the other inverse solution (paired t-test, p < 0.01).
Figure 5.
Figure 5.. AUCPR, relative energy, and focalization error of MN and MN-Face inverse solutions.
ROIs are color coded according to Figure 4. Asterisks indicate significant differences between MN and MN-FACE results (paired t-test p < 0.01).
Figure 6.
Figure 6.. Network model and the resulting MAR signals used for a functional connectivity analysis simulation.
In the upper left, the three left hemisphere ROIs are shown on an example brain. In the lower left, the network structure, which created the MAR input is presented with the nodes color-coded as in the ROIs. On the right, the amplitude spectral densities of the ROI signals are presented.
Figure 7.
Figure 7.. Connectivity matrices (top) and AUCPR estimates (bottom) for ICoh and WPLI at 8Hz and at different SNR levels.
The upper row shows the connectivity matrices for ICoh and WPLI at SNR= −15 dB. The colorbar indicates the normalized estimated connectivity strength. The matrix elements marked with green frames indicate the gold standard FC elements. The simulated FC at this frequency was present between V1d and V3d, and V3d and TO1. The lower row plots the mean AUCPR of Icoh and WPLI, with standard error of mean presented as error bars. The stars indicate significant differences between ICoh and WPLI results (paired t-test p < 0.01)
Figure 8.
Figure 8.. Spatial filter topography maps of three decomposition techniques.
The left most column presents the lead fields corresponding to source 1 (V2d-R) and source 2 (LO1-L) averaged over 10 subjects (Normalized to have values between 0 and 1). The normalized topographic maps of each filter for their first and second component are presented (averaged over 10 subjects and trials) over different SNR values (each SNR value is presented in one row) are shown in the second to sixth columns.
Figure 9.
Figure 9.. Angular Error, Normalized Residuals and Reconstruction SNRs of three spatial filters.
The first columns represent the results of the first components of PCA, RCA and SSD, averaged over subjects and trials. The same results for the second components are presented in the second column.

Similar articles

Cited by

References

    1. Acar ZA, Makeig S (2013) Effects of forward model errors on EEG source localization. Brain Topogr 26:378–396. - PMC - PubMed
    1. Ahlfors SP, Han J, Belliveau JW, Hämäläinen MS (2010a) Sensitivity of MEG and EEG to source orientation. Brain Topogr 23:227–232. - PMC - PubMed
    1. Ahlfors SP, Han J, Lin F-H, Witzel T, Belliveau JW, Hämäläinen MS, Halgren E (2010b) Cancellation of EEG and MEG signals generated by extended and distributed sources. Hum Brain Mapp 31:140–149. - PMC - PubMed
    1. Argall BD, Saad ZS, Beauchamp MS (2006) Simplified intersubject averaging on the cortical surface using SUMA. Hum Brain Mapp 27:14–27. - PMC - PubMed
    1. Astolfi L, Cincotti F, Mattia D, Salinari S, Babiloni C, Basilisco A, Rossini PM, Ding L, Ni Y, He B (2004) Estimation of the effective and functional human cortical connectivity with structural equation modeling and directed transfer function applied to high-resolution EEG. Magn Reson Imaging 22:1457–1470. - PubMed

Publication types

LinkOut - more resources