

Neural activation and connectivity during cued eye blinks in Chronic Tic Disorders
- PMID: 31382238
- PMCID: PMC6698693
- DOI: 10.1016/j.nicl.2019.101956
Neural activation and connectivity during cued eye blinks in Chronic Tic Disorders
Abstract
Objective: The pathophysiology of Chronic Tic Disorders (CTDs), including Tourette Syndrome, remains poorly understood. The goal of this study was to compare neural activity and connectivity during a voluntary movement (VM) paradigm that involved cued eye blinks among children with and without CTDs. Using the precise temporal resolution of electroencephalography (EEG), we used the timing and location of cortical source resolved spectral power activation and connectivity to map component processes such as visual attention, cue detection, blink regulation and response monitoring. We hypothesized that neural activation and connectivity during the cued eye blink paradigm would be significantly different in regions typically associated with effortful control of eye blinks, such as frontal, premotor, parietal, and occipital cortices between children with and without CTD.
Method: Participants were 40 children (23 with CTD, 17 age-matched Healthy Control [HC]), between the ages of 8-12 (mean age = 9.5) years old. All participants underwent phenotypic assessment including diagnostic interviews, behavior rating scales and 128-channel EEG recording. Upon presentation of a cue every 3 s, children were instructed to make an exaggerated blink.
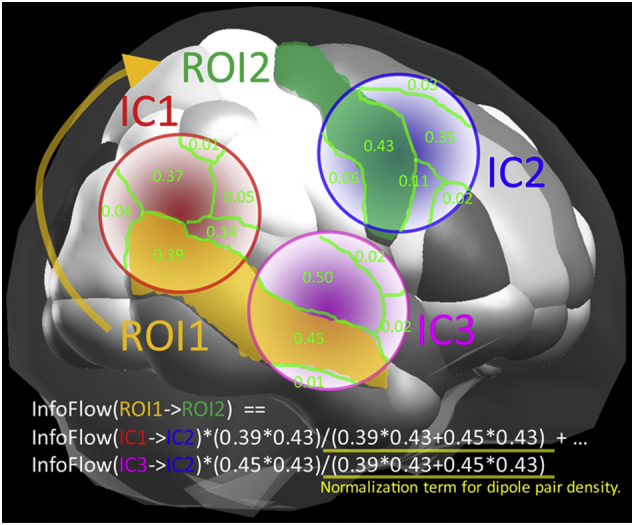
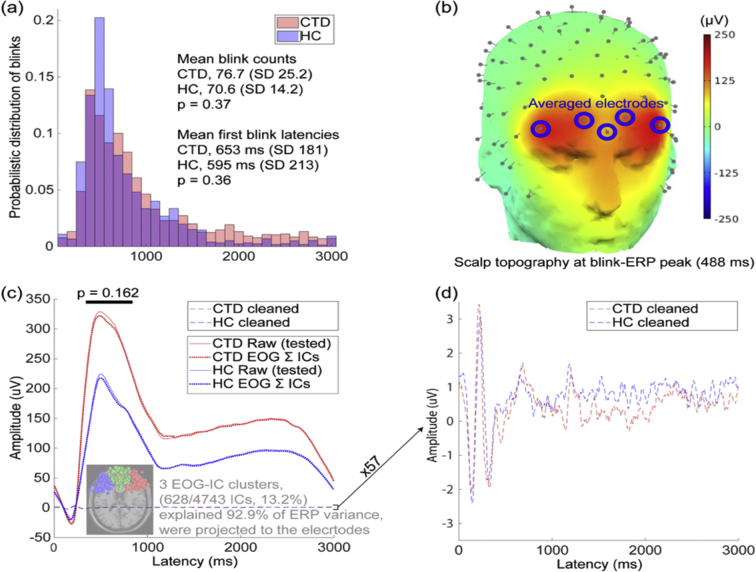
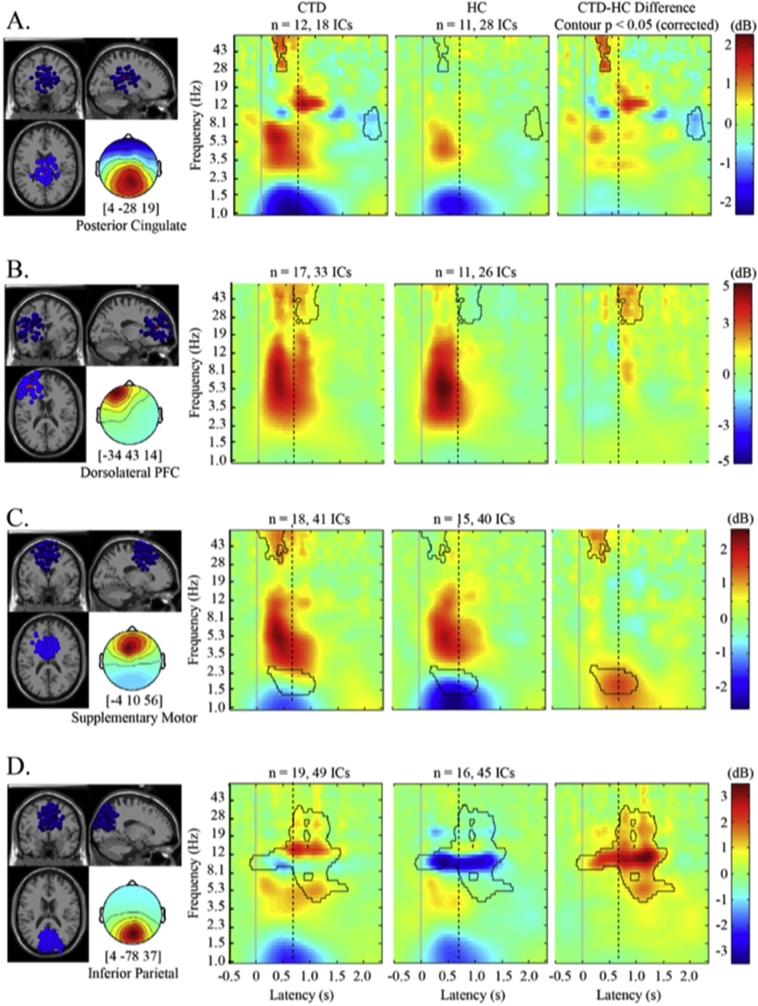
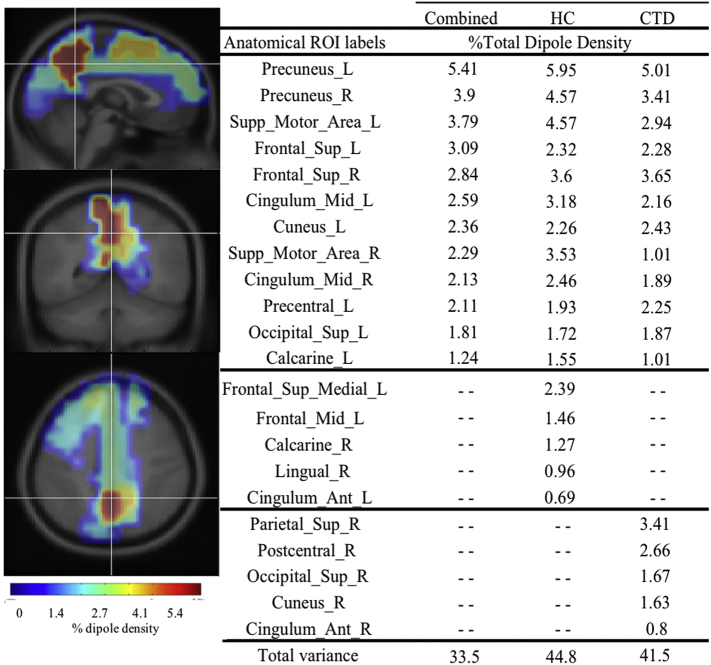
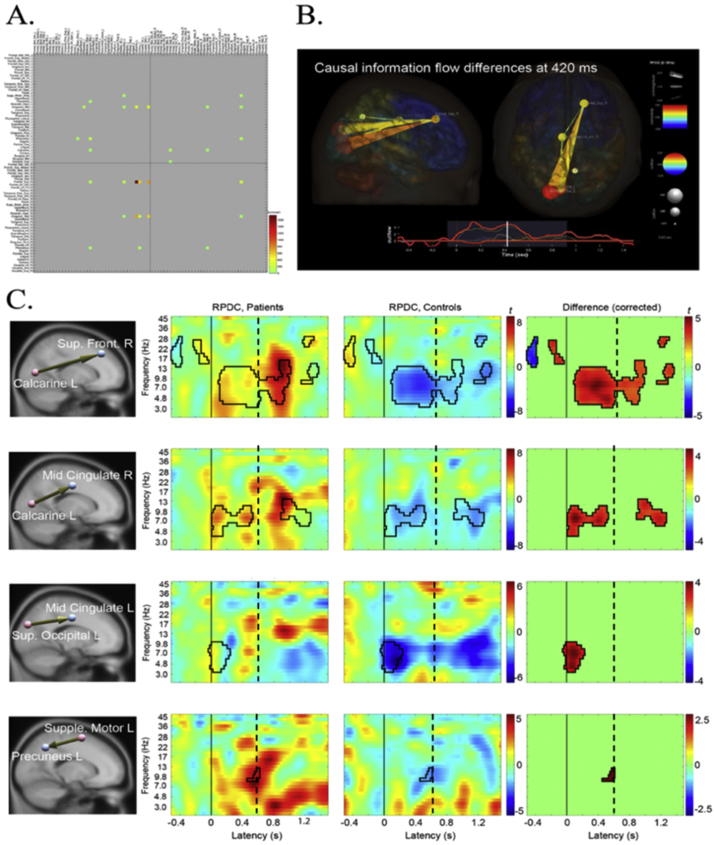
Results: Behaviorally, the groups did not differ in blink number, latency, or ERP amplitude. Within source resolved clusters located in left dorsolateral prefrontal cortex, posterior cingulate, and supplemental motor area, children with CTD exhibited higher gamma band spectral power relative to controls. In addition, significant diagnostic group differences in theta, alpha, and beta band power in inferior parietal cortex emerged. Spectral power differences were significantly associated with clinical characteristics such as tic severity and premonitory urge strength. After calculating dipole density for 76 anatomical regions, the CTD and HC groups had 70% overlap of top regions with the highest dipole density, suggesting that similar cortical networks were used across groups to carry out the VM. The CTD group exhibited significant information flow increase and dysregulation relative to the HC group, particularly from occipital to frontal regions.
Conclusion: Children with CTD exhibit abnormally high levels of neural activation and dysregulated connectivity among networks used for regulation and effortful control of voluntary eye blinks.
Keywords: Attention network; EEG; Gamma power; Pediatric; Tourette syndrome.
Copyright © 2019 The Authors. Published by Elsevier Inc. All rights reserved.
Figures
Similar articles
-
Brain functional connectivity in chronic tic disorders and Gilles de la Tourette syndrome.Prog Neurobiol. 2020 Nov;194:101884. doi: 10.1016/j.pneurobio.2020.101884. Epub 2020 Jul 10. Prog Neurobiol. 2020. PMID: 32659317
-
Inhibitory control in children with tic disorder: aberrant fronto-parietal network activity and connectivity.Brain Commun. 2021 Apr 9;3(2):fcab067. doi: 10.1093/braincomms/fcab067. eCollection 2021. Brain Commun. 2021. PMID: 33977267 Free PMC article.
-
An FMRI study of frontostriatal circuits during the inhibition of eye blinking in persons with Tourette syndrome.Am J Psychiatry. 2010 Mar;167(3):341-9. doi: 10.1176/appi.ajp.2009.08121831. Epub 2010 Jan 15. Am J Psychiatry. 2010. PMID: 20080981 Free PMC article.
-
Temporal relationship between premonitory urges and tics in Gilles de la Tourette syndrome.Cortex. 2016 Apr;77:24-37. doi: 10.1016/j.cortex.2016.01.008. Epub 2016 Jan 23. Cortex. 2016. PMID: 26922503
-
[Cortical Functional Connectivity during Cued vs. Implicit Modality-Specific Anticipatory Attention: EEG-Source Alpha Coherence Analysis].Zh Vyssh Nerv Deiat Im I P Pavlova. 2015 Nov-Dec;65(6):661-75. Zh Vyssh Nerv Deiat Im I P Pavlova. 2015. PMID: 26841654 Review. Russian.
Cited by
-
Semantic processing during continuous speech production: an analysis from eye movements and EEG.Front Hum Neurosci. 2023 Sep 1;17:1253211. doi: 10.3389/fnhum.2023.1253211. eCollection 2023. Front Hum Neurosci. 2023. PMID: 37727862 Free PMC article.
-
Premonitory urge in tic disorders - a scoping review.Front Psychiatry. 2025 Jan 30;16:1504442. doi: 10.3389/fpsyt.2025.1504442. eCollection 2025. Front Psychiatry. 2025. PMID: 39950174 Free PMC article.
-
Altered network connectivity and global efficiency in tourette syndrome: insights into sensorimotor integration.Neuroimage Clin. 2025 Jul 13;48:103845. doi: 10.1016/j.nicl.2025.103845. Online ahead of print. Neuroimage Clin. 2025. PMID: 40683122 Free PMC article.
-
A randomized controlled trial into the effects of probiotics on electroencephalography in preschoolers with autism.Autism. 2023 Jan;27(1):117-132. doi: 10.1177/13623613221082710. Epub 2022 Apr 1. Autism. 2023. PMID: 35362336 Free PMC article. Clinical Trial.
-
Beyond the Cortico-Centric Models of Cognition: The Role of Subcortical Functioning in Neurodevelopmental Disorders.Front Psychol. 2019 Dec 11;10:2809. doi: 10.3389/fpsyg.2019.02809. eCollection 2019. Front Psychol. 2019. PMID: 31920851 Free PMC article. No abstract available.
References
-
- Abi-Jaoude E., Segura B., Cho S.S., Crawley A., Sandor P. The neural correlates of self-regulatory fatigability during inhibitory control of eye blinking. J. Neuropsychiatr. Clin. Neurosci. Fall 2018;30(4):325–333. - PubMed
-
- Achenbach T.M. University of Vermont Department of Psychiatry; Burlington, VT: 2000. Manual for the Child Behavior Checklist/4-18 and 1991 Profile.
-
- Albin R.L., Mink J.W. Recent advances in Tourette syndrome research. Trends Neurosci. 2006;29(3):175–182. Mar. - PubMed
-
- Baddeley A. Working memory: theories, models, and controversies. Annu. Rev. Psychol. 2012;63:1–29. - PubMed
-
- Barnett L., Seth A.K. Behaviour of granger causality under filtering: theoretical invariance and practical application. J. Neurosci. Methods. Oct 15 2011;201(2):404–419. - PubMed
Publication types
MeSH terms
Grants and funding
LinkOut - more resources
Full Text Sources
