Effect of Iron Supplementation on the Outcome of Non-Progressive Pulmonary Mycobacterium tuberculosis Infection
- PMID: 31382404
- PMCID: PMC6722820
- DOI: 10.3390/jcm8081155
Effect of Iron Supplementation on the Outcome of Non-Progressive Pulmonary Mycobacterium tuberculosis Infection
Abstract
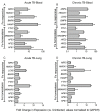
The human response to Mycobacterium tuberculosis (Mtb) infection is affected by the availability of iron (Fe), which is necessary for proper immune cell function and is essential for the growth and virulence of bacteria. Increase in host Fe levels promotes Mtb growth and tuberculosis (TB) pathogenesis, while Fe-supplementation to latently infected, asymptomatic individuals is a significant risk factor for disease reactivation. However, the effect of Fe-supplementation on the host immunity during latent Mtb infection remains unclear, due partly to the paucity in availability of animal models that recapitulate key pathophysiological features seen in humans. We have demonstrated that rabbits can develop non-progressive latency similar to infected humans. In this study, using this model we have evaluated the effect of Fe-supplementation on the bacterial growth, disease pathology, and immune response. Systemic and lung Fe parameters, gene expression profile, lung bacterial burden, and disease pathology were determined in the Mtb-infected/Fe- or placebo-supplemented rabbits. Results show that Fe-supplementation to Mtb-infected rabbits did not significantly change the hematocrit and Hb levels, although it elevated total Fe in the lungs. Expression of selected host iron- and immune-response genes in the blood and lungs was perturbed in Mtb-infected/Fe-supplemented rabbits. Iron-supplementation during acute or chronic stages of Mtb infection did not significantly affect the bacterial burden or disease pathology in the lungs. Data presented in this study is of significant relevance for current public health policies on Fe-supplementation therapy given to anemic patients with latent Mtb infection.
Keywords: Mycobacterium tuberculosis; Perls’ stain; gene expression; immune response; iron supplementation; latent infection; pathology; pulmonary; rabbit; tuberculosis.
Conflict of interest statement
The authors declare no conflict of interest.
Figures


Similar articles
-
Early innate immunity determines outcome of Mycobacterium tuberculosis pulmonary infection in rabbits.Cell Commun Signal. 2013 Aug 19;11:60. doi: 10.1186/1478-811X-11-60. Cell Commun Signal. 2013. PMID: 23958185 Free PMC article.
-
Effect of Mycobacterium tuberculosis infection on adipocyte physiology.Microbes Infect. 2018 Feb;20(2):81-88. doi: 10.1016/j.micinf.2017.10.008. Epub 2017 Nov 8. Microbes Infect. 2018. PMID: 29109018 Free PMC article.
-
Molecular immunologic correlates of spontaneous latency in a rabbit model of pulmonary tuberculosis.Cell Commun Signal. 2013 Feb 28;11(1):16. doi: 10.1186/1478-811X-11-16. Cell Commun Signal. 2013. PMID: 23448601 Free PMC article.
-
Genome wide approaches discover novel Mycobacterium tuberculosis antigens as correlates of infection, disease, immunity and targets for vaccination.Semin Immunol. 2018 Oct;39:88-101. doi: 10.1016/j.smim.2018.07.001. Epub 2018 Jul 7. Semin Immunol. 2018. PMID: 30327124 Review.
-
One Size Fits All? Not in In Vivo Modeling of Tuberculosis Chemotherapeutics.Front Cell Infect Microbiol. 2021 Mar 16;11:613149. doi: 10.3389/fcimb.2021.613149. eCollection 2021. Front Cell Infect Microbiol. 2021. PMID: 33796474 Free PMC article. Review.
Cited by
-
Relationship between iron deficiency and severity of tuberculosis: Influence on T cell subsets.iScience. 2024 Dec 30;28(2):111709. doi: 10.1016/j.isci.2024.111709. eCollection 2025 Feb 21. iScience. 2024. PMID: 39898042 Free PMC article.
-
Mycobacterium tuberculosis hijacks host TRIM21- and NCOA4-dependent ferritinophagy to enhance intracellular growth.J Clin Invest. 2023 Apr 17;133(8):e159941. doi: 10.1172/JCI159941. J Clin Invest. 2023. PMID: 37066876 Free PMC article.
-
Omega-3 Fatty Acid and Iron Supplementation Alone, but Not in Combination, Lower Inflammation and Anemia of Infection in Mycobacterium tuberculosis-Infected Mice.Nutrients. 2020 Sep 22;12(9):2897. doi: 10.3390/nu12092897. Nutrients. 2020. PMID: 32971969 Free PMC article.
-
Iron deprivation enhances transcriptional responses to in vitro growth arrest of Mycobacterium tuberculosis.Front Microbiol. 2022 Oct 4;13:956602. doi: 10.3389/fmicb.2022.956602. eCollection 2022. Front Microbiol. 2022. PMID: 36267176 Free PMC article.
-
Iron Status and Supplementation during Tuberculosis.Microorganisms. 2023 Mar 18;11(3):785. doi: 10.3390/microorganisms11030785. Microorganisms. 2023. PMID: 36985358 Free PMC article. Review.
References
Grants and funding
LinkOut - more resources
Full Text Sources
Molecular Biology Databases

