

Characterization and Relaxation Properties of a Series of Monodispersed Magnetic Nanoparticles
- PMID: 31382433
- PMCID: PMC6696352
- DOI: 10.3390/s19153396
Characterization and Relaxation Properties of a Series of Monodispersed Magnetic Nanoparticles
Abstract
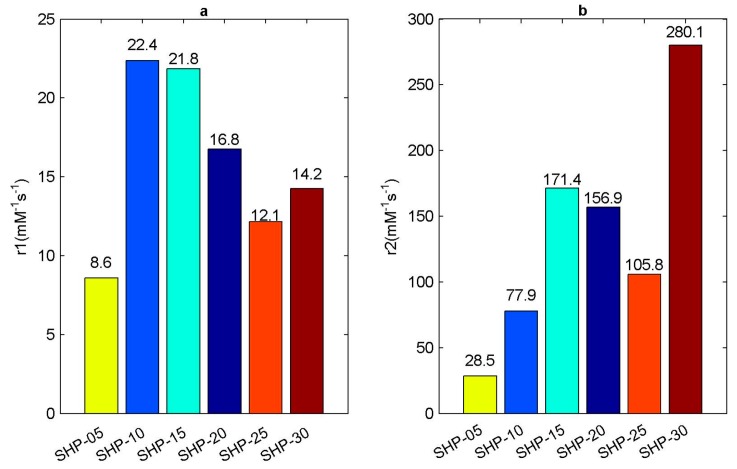
Magnetic iron oxide nanoparticles are relatively advanced nanomaterials, and are widely used in biology, physics and medicine, especially as contrast agents for magnetic resonance imaging. Characterization of the properties of magnetic nanoparticles plays an important role in the application of magnetic particles. As a contrast agent, the relaxation rate directly affects image enhancement. We characterized a series of monodispersed magnetic nanoparticles using different methods and measured their relaxation rates using a 0.47 T low-field Nuclear Magnetic Resonance instrument. Generally speaking, the properties of magnetic nanoparticles are closely related to their particle sizes; however, neither longitudinal relaxation rate r 1 nor transverse relaxation rate r 2 changes monotonously with the particle size d . Therefore, size can affect the magnetism of magnetic nanoparticles, but it is not the only factor. Then, we defined the relaxation rates r i ' (i = 1 or 2) using the induced magnetization of magnetic nanoparticles, and found that the correlation relationship between r 1 ' relaxation rate and r 1 relaxation rate is slightly worse, with a correlation coefficient of R 2 = 0.8939, while the correlation relationship between r 2 ' relaxation rate and r 2 relaxation rate is very obvious, with a correlation coefficient of R 2 = 0.9983. The main reason is that r 2 relaxation rate is related to the magnetic field inhomogeneity, produced by magnetic nanoparticles; however r 1 relaxation rate is mainly a result of the direct interaction of hydrogen nucleus in water molecules and the metal ions in magnetic nanoparticles to shorten the T 1 relaxation time, so it is not directly related to magnetic field inhomogeneity.
Keywords: Langevin model; contrast agent; magnetic field inhomogeneity; magnetic nanoparticles; relaxation; relaxation rate.
Conflict of interest statement
The authors declare no conflict of interest.
Figures


Similar articles
-
The effect of magnetically induced linear aggregates on proton transverse relaxation rates of aqueous suspensions of polymer coated magnetic nanoparticles.Nanoscale. 2013 Mar 7;5(5):2152-63. doi: 10.1039/c3nr32979h. Epub 2013 Feb 6. Nanoscale. 2013. PMID: 23389324
-
Relaxation behavior study of ultrasmall superparamagnetic iron oxide nanoparticles at ultralow and ultrahigh magnetic fields.J Phys Chem B. 2011 Dec 15;115(49):14789-93. doi: 10.1021/jp2066138. Epub 2011 Nov 10. J Phys Chem B. 2011. PMID: 21972868
-
NMR relaxation and magnetic properties of superparamagnetic nanoworms.Contrast Media Mol Imaging. 2010 Nov-Dec;5(6):318-22. doi: 10.1002/cmmi.387. Contrast Media Mol Imaging. 2010. PMID: 21190269 Free PMC article.
-
Magnetic resonance relaxation properties of superparamagnetic particles.Wiley Interdiscip Rev Nanomed Nanobiotechnol. 2009 May-Jun;1(3):299-310. doi: 10.1002/wnan.36. Wiley Interdiscip Rev Nanomed Nanobiotechnol. 2009. PMID: 20049798 Review.
-
Magnetic iron oxide nanoparticles for biomedical applications.Future Med Chem. 2010 Mar;2(3):427-49. doi: 10.4155/fmc.09.164. Future Med Chem. 2010. PMID: 21426176 Review.
Cited by
-
Magnetic-Plasmonic Core-Shell Nanoparticles: Properties, Synthesis and Applications for Cancer Detection and Treatment.Nanomaterials (Basel). 2025 Feb 10;15(4):264. doi: 10.3390/nano15040264. Nanomaterials (Basel). 2025. PMID: 39997827 Free PMC article. Review.
-
Advances in Plasmonic Sensing at the NIR-A Review.Sensors (Basel). 2021 Mar 17;21(6):2111. doi: 10.3390/s21062111. Sensors (Basel). 2021. PMID: 33802958 Free PMC article. Review.
References
-
- Lang X.Y., Zheng W.T., Jiang Q. Size and interface effects on ferromagnetic and antiferromagnetic transition temperatures. Phys. Rev. B. 2006;73:224444. doi: 10.1103/PhysRevB.73.224444. - DOI
-
- He L., Liu W., Xie Q., Pi S., Morais P.C. A fast and remote magnetonanothermometry for a liquid environment. Meas. Sci. Technol. 2016;27:025901. doi: 10.1088/0957-0233/27/2/025901. - DOI
MeSH terms
Substances
Grants and funding
LinkOut - more resources
Full Text Sources
Research Materials
