. 2019 Aug 5;20(1):631.
doi: 10.1186/s12864-019-5983-8.

The molecular mass and isoelectric point of plant proteomes

Affiliations

The molecular mass and isoelectric point of plant proteomes

Tapan Kumar Mohanta et al. BMC Genomics. .

Abstract

Background: Cell contain diverse array of proteins with different molecular weight and isoelectric point (pI). The molecular weight and pI of protein play important role in determining the molecular biochemical function. Therefore, it was important to understand the detail regarding the molecular weight and pI of the plant proteins.

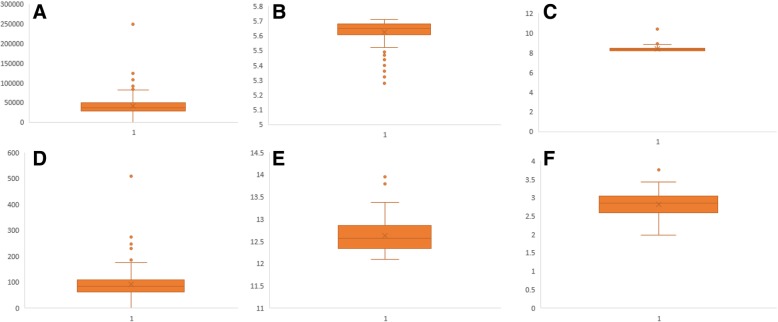
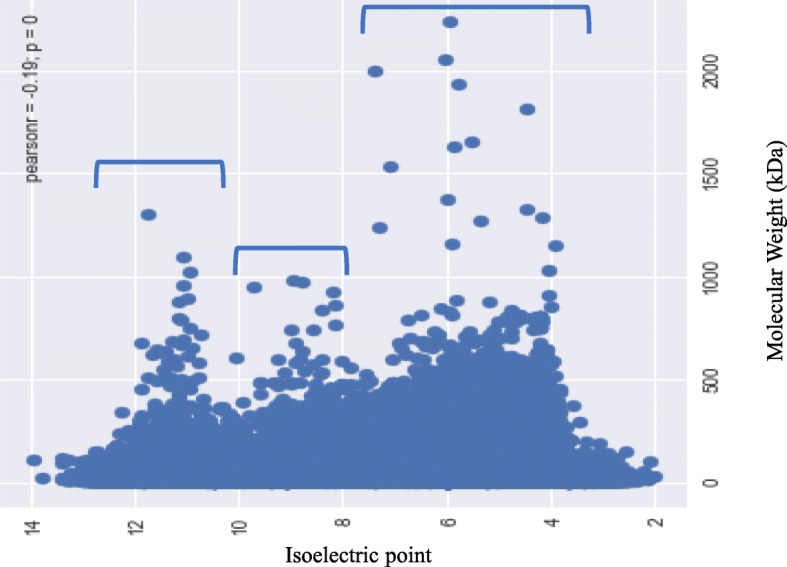
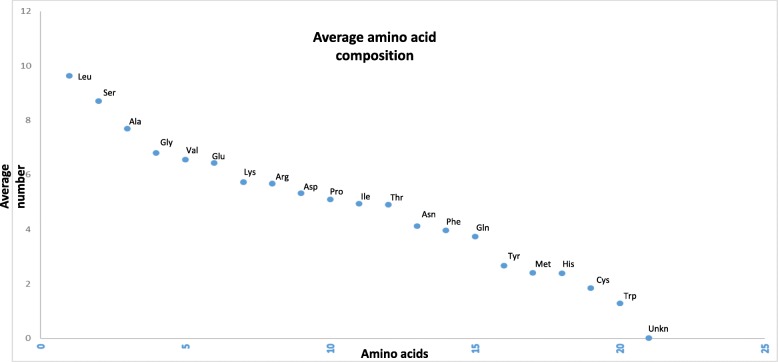
Results: A proteome-wide analysis of plant proteomes from 145 species revealed a pI range of 1.99 (epsin) to 13.96 (hypothetical protein). The spectrum of molecular mass of the plant proteins varied from 0.54 to 2236.8 kDa. A putative Type-I polyketide synthase (22244 amino acids) in Volvox carteri was found to be the largest protein in the plant kingdom. However, Type-I polyketide synthase was not found in higher plant species. Titin (806.46 kDa) and misin/midasin (730.02 kDa) were the largest proteins identified in higher plant species. The pI and molecular weight of the plant proteins showed a trimodal distribution. An acidic pI (56.44% of proteins) was found to be predominant over a basic pI (43.34% of proteins) and the abundance of acidic pI proteins was higher in unicellular algae species relative to multicellular higher plants. In contrast, the seaweed, Porphyra umbilicalis, possesses a higher proportion of basic pI proteins (70.09%). Plant proteomes were also found to contain selenocysteine (Sec), amino acid that was found only in lower eukaryotic aquatic plant lineage. Amino acid composition analysis showed Leu was high and Trp was low abundant amino acids in the plant proteome. Additionally, the plant proteomes also possess ambiguous amino acids Xaa (unknown), Asx (asparagine or aspartic acid), Glx (glutamine or glutamic acid), and Xle (leucine or isoleucine) as well.

Conclusion: The diverse molecular weight and isoelectric point range of plant proteome will be helpful to understand their biochemical and functional aspects. The presence of selenocysteine proteins in lower eukaryotic organism is of interest and their expression in higher plant system can help us to understand their functional role.

Keywords: Amino acids; Isoelectric point; Molecular weight; Proteome; Pyrrolysine; Selenocysteine.


Figures

Fig. 1
Fig. 1
Box and Whisker plot of (a) average number of protein sequences encoded in plant proteome, b average acidic pI, c average basic pI of plant proteome, d average number of neutral pI proteins per plant proteome (e) average of highest pI protein, and (f) average of lowest pI proteins. Details can be found in Additional file 2: Table S1
Fig. 2
Fig. 2
Principal component analysis (PCA) of acidic pI proteins. The PCA plot illustrates the relationship between the acidic pI of bryophytes and monocot plants which exhibit a linear correlation relative to algae and eudicots. In the figure (a) scores: show the similarities in sample grouping, b loading: represents the relative position of a variables and how it relates the samples to the different variables (c). Influence plot: represents the Q- or F-residuals vs. Leverage or Hotelling T2 statistics that show the residual statistics on the ordinate axis of sample distance to model, and (d) variance: represents the variation in the data described by the different components. Total residual variance is computed as sum of square of residuals for all the variables, divided by the number of degrees of freedom. The green colour indicates the calibration and the red indicates the validation
Fig. 3
Fig. 3
Principal component analysis (PCA) of basic pI proteins. The PCA plot illustrates that the basic pI of algae, bryophytes, eudicots, and monocot plants cluster distinctly from each other and that there is no lineage-specific correlation with basic pI proteins. In the figure (a) scores: show the similarities in sample grouping, (b) loading: represents the relative position of a variables and how it relates the samples to the different variables (c) Influence plot: represents the Q- or F-residuals vs. Leverage or Hotelling T2 statistics that show the residual statistics on the ordinate axis of sample distance to model, and (d) variance: represents the variation in the data described by the different components. Total residual variance is computed as sum of square of residuals for all the variables, divided by the number of degrees of freedom. The green colour indicates the calibration and the red indicates the validation
Fig. 4
Fig. 4
Trimodal distribution of isoelectric points (pI) and the molecular mass (kDa) of plant proteins. The pI of plant proteins ranged from 1.99 (epsin) to 13.96 (hypothetical protein), while the molecular mass ranged from 0.54 (unknown) to 2236.8 (type I polyketide synthase) kDa. The X-axis represents the pI and the Y- axis represents the molecular mass of the proteins
Fig. 5
Fig. 5
Average amino acid composition of proteins in the plant kingdom. Leu is the most abundant while Trp is the least abundant. The amino acid, Sec, was only found in a few species of algae and was absent from all other species. Ambiguous amino acids were found in a few species as well
Fig. 6
Fig. 6
Principal component analysis (PCA) of amino acid abundance in plant proteomes. The PCA plot shows that Tyr, Trp, Cys, His, Met, and Xaa (unknown) amino acids are low-abundance and cluster together. The abundance of Leu, Ser, Ile, Lys, and Gln was higher and grouped together. The plot shows that the abundance of amino acids is lineage specific. Algae, eudicots, and monocot plants exhibit a lineage specific correlation. In the figure (a) scores: show the similarities in sample grouping, (b) loading: represents the relative position of a variables and how it relates the samples to the different variables (c) Influence plot: represents the Q- or F-residuals vs. Leverage or Hotelling T2 statistics that show the residual statistics on the ordinate axis of sample distance to model, and (d) variance: represents the variation in the data described by the different components. Total residual variance is computed as sum of square of residuals for all the variables, divided by the number of degrees of freedom. The green colour indicates the calibration and the red indicates the validation
Fig. 7
Fig. 7
Schematic illustration of the biosynthetic pathway of amino acids. The abundance of aromatic ring containing amino acids is lower relative to other amino acids. The average abundance of the aromatic ring containing amino acid, Trp, is the lowest amongst others that are biosynthesized via phosphoenolpyruvate and erythrose 4-phosphate. Similarly, the abundance of Cys is relatively low compared to other amino acids. Ser is biosynthesized from 3-phosphoglycerate and Ser is subsequently used to produce Gly and Cys amino acids. The abundance of Cys is lower relative to Gly, suggesting the existence of allosteric feed-back inhibition of the biosynthesis of Cys by Ser

Similar articles

Cited by

References

    1. Kirkwood J, Hargreaves D, O’Keefe S, Wilson J. Using isoelectric point to determine the pH for initial protein crystallization trials. Bioinformatics. 2015;31:1444–1451. doi: 10.1093/bioinformatics/btv011. - DOI - PMC - PubMed
    1. Kozlowski LP. IPC – Isoelectric Point Calculator. Biol Direct. 2016;11:55. doi: 10.1186/s13062-016-0159-9. - DOI - PMC - PubMed
    1. Kozlowski LP. Proteome-pI: proteome isoelectric point database. Nucleic acids res. 2016/10/26. Oxford University Press. 2017;45:D1112–D1116. - PMC - PubMed
    1. Stekhoven F, Gorissen M, Flik G. The isoelectric point, a key to understanding a variety of biochemical problems: a minireview. Fish Physiol Biochem. 2008;34:1–8. doi: 10.1007/s10695-007-9145-6. - DOI - PubMed
    1. Kenneth W, Kenneth G, Raymond E. General Chemistry. 4th ed. Saunders College Publishing; 1992.