. 2019 Aug 5;19(1):339.
doi: 10.1186/s12870-019-1955-z.

Diverse biological effects of glycosyltransferase genes from Tartary buckwheat

Affiliations

Diverse biological effects of glycosyltransferase genes from Tartary buckwheat

Panfeng Yao et al. BMC Plant Biol. .

Abstract

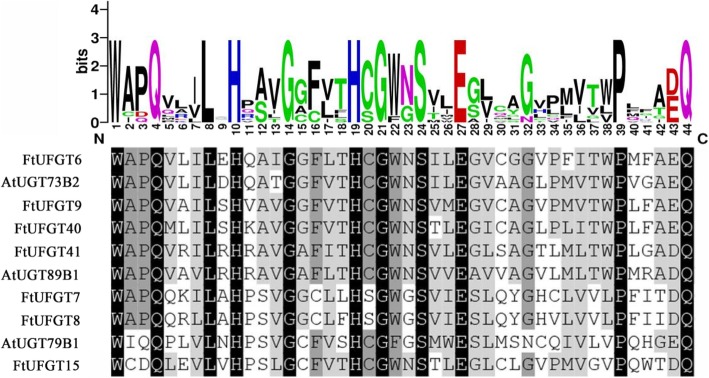
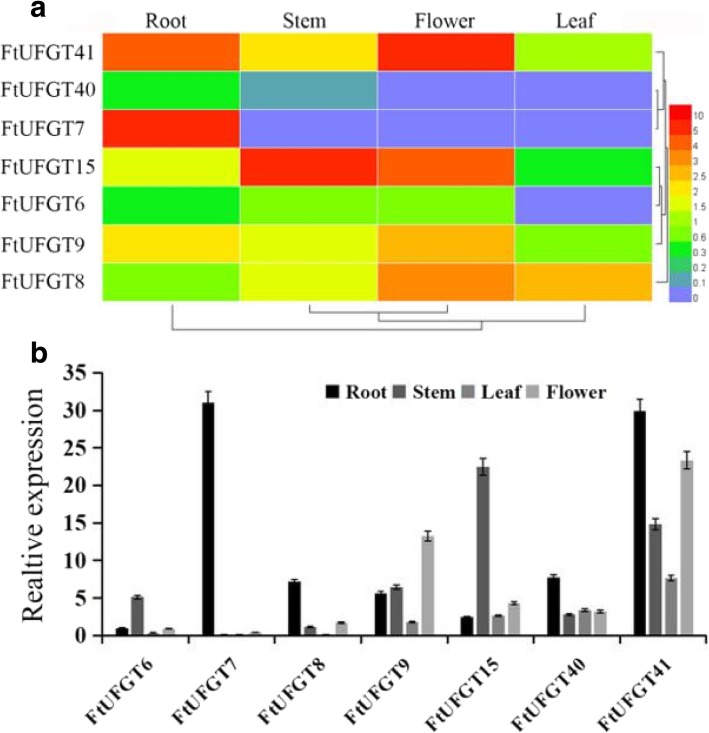
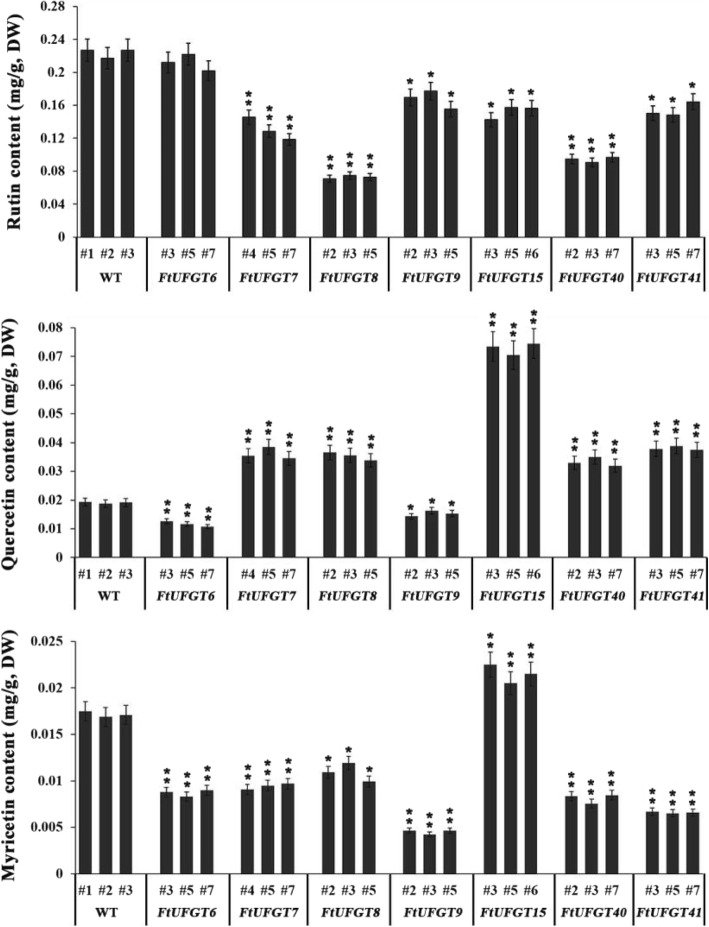
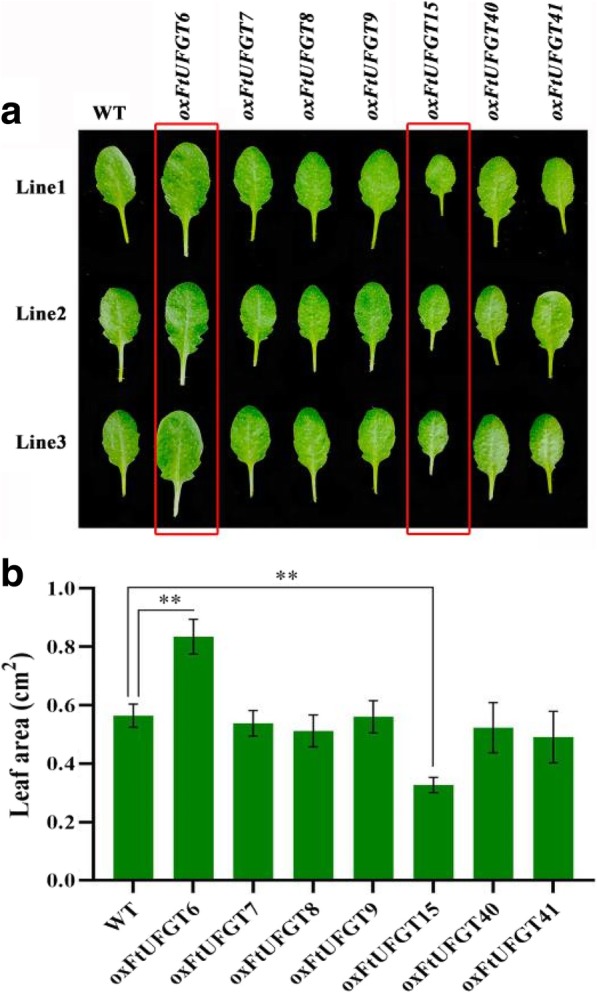
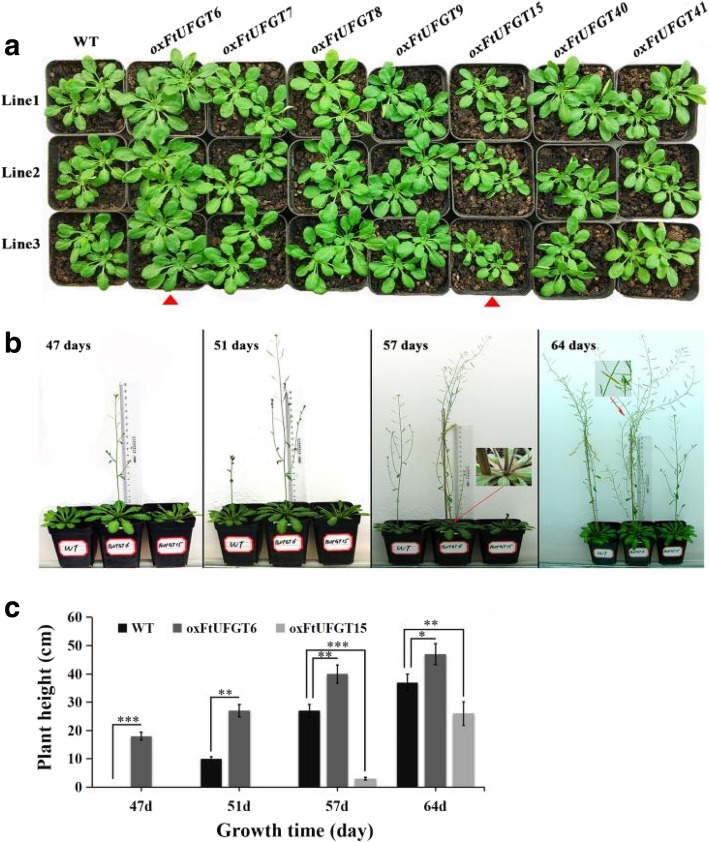
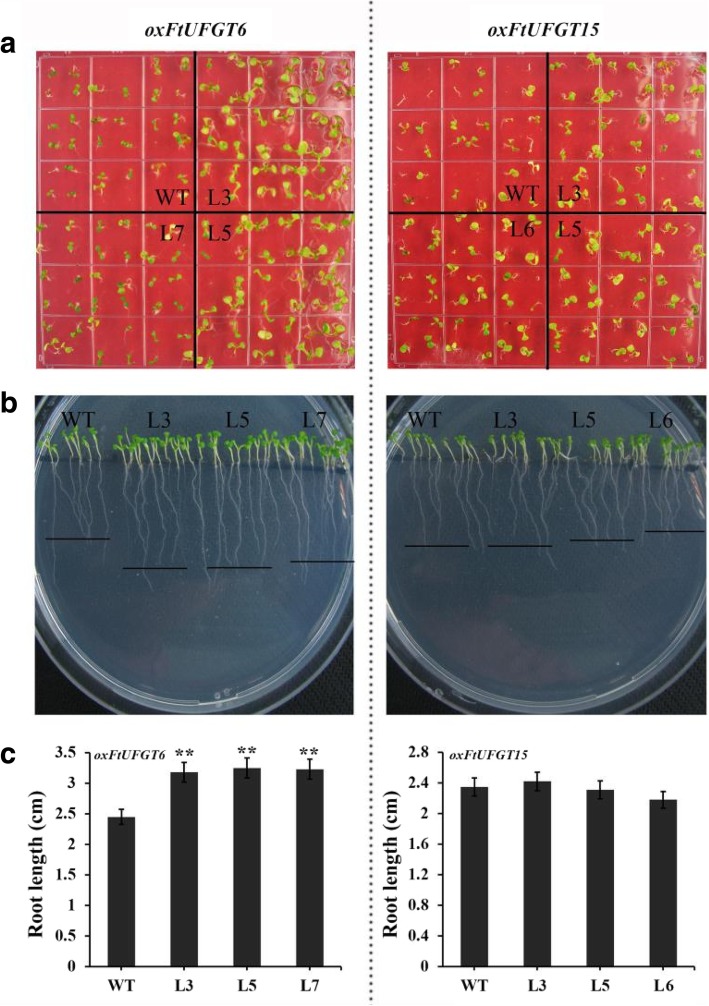
Background: Tartary buckwheat (Fagopyrum tataricum) is an edible cereal crop whose sprouts have been marketed and commercialized for their higher levels of anti-oxidants, including rutin and anthocyanin. UDP-glucose flavonoid glycosyltransferases (UFGTs) play an important role in the biosynthesis of flavonoids in plants. So far, few studies are available on UFGT genes that may play a role in tartary buckwheat flavonoids biosynthesis. Here, we report on the identification and functional characterization of seven UFGTs from tartary buckwheat that are potentially involved in flavonoid biosynthesis (and have varying effects on plant growth and development when overexpressed in Arabidopsis thaliana.) RESULTS: Phylogenetic analysis indicated that the potential function of the seven FtUFGT proteins, FtUFGT6, FtUFGT7, FtUFGT8, FtUFGT9, FtUFGT15, FtUFGT40, and FtUFGT41, could be divided into three Arabidopsis thaliana functional subgroups that are involved in flavonoid biosynthesis of and anthocyanin accumulation. A significant positive correlation between FtUFGT8 and FtUFGT15 expression and anthocyanin accumulation capacity was observed in the tartary buckwheat seedlings after cold stress. Overexpression in Arabidopsis thaliana showed that FtUFGT8, FtUFGT15, and FtUFGT41 significantly increased the anthocyanin content in transgenic plants. Unexpectedly, overexpression of FtUFGT6, while not leading to enhanced anthocyanin accumulation, significantly enhanced the growth yield of transgenic plants. When wild-type plants have only cotyledons, most of the transgenic plants of FtUFGT6 had grown true leaves. Moreover, the growth speed of the oxFtUFGT6 transgenic plant root was also significantly faster than that of the wild type. At later growth, FtUFGT6 transgenic plants showed larger leaves, earlier twitching times and more tillers than wild type, whereas FtUFGT15 showed opposite results.

Conclusions: Seven FtUFGTs were isolated from tartary buckwheat. FtUFGT8, FtUFGT15, and FtUFGT41 can significantly increase the accumulation of total anthocyanins in transgenic plants. Furthermore, overexpression of FtUFGT6 increased the overall yield of Arabidopsis transgenic plants at all growth stages. However, FtUFGT15 shows the opposite trend at later growth stage and delays the growth speed of plants. These results suggested that the biological function of FtUFGT genes in tartary buckwheat is diverse.

Keywords: Anthocyanins; Development; Flavonoids glycosyltransferase; Tartary buckwheat.


Conflict of interest statement

The authors declare that they have no competing interests.

Figures

Fig. 1
Fig. 1
Sequence conservation analysis of the PSPG motif in the seven tartary buckwheat FtUFGT proteins. The multiple sequence alignment was performed using a ClustalX program
Fig. 2
Fig. 2
Phylogenetic analysis of selected plant GTs and putative tartary buckwheat UFGTs. Bar = 0.2 amino acid substitutions per site. Functional clusters (I, II, IIIa, IIIb and IV) of flavonoid UGTs are circled. Black point represent UFGTs in tartary buckwheat. Black triangle represent UFGTs have been studied in tartary buckwheat. The Genbank accession numbers for the sequences are shown in parentheses: AtF3RT (NP_197207); PfF3GT (BAA19659); PhF3GT (BAA89008); HvF3GT (CAA33729); VvGT1 (AAB81682); AtF3Rht (NP_564357); CpF3T (ACS15351); CsUGT78A14 (ALO19888); CsUGT78A15 (XP_028088706); VhA5GT (BAA36423); AtF5GT, AAM91686; PfA5GT, Q9ZR27; PhA5GT, BAA36421; ThA5GT, BAC54093; NtGT2, BAB88935; IhA5GT (Q767C8); AtUGT74F1 (NP_973682); Pg84A23 (ANN02875); CsUGT84A22 (ALO19890); TOGT1 (AAK28303); AtF7GT (AAL90934); GeIF7GT (BAC78438); SbF7GT (BAA83484); Lb7GT (BAG80536); FaGT7 (Q2V6J9); AmUGT21 (BAG31950); PfUGT31 (BAG31952); AmUGT36 (BAG16513); PfUGT2 (BAG31951); AtF3G7GT (Q9ZQ95); MtUGT72L1 (ACC38470); AtUGT71B6 (NP_188815); LjUGT72Z2 (AKK25344); FaGT6 (Q2V6K0); AtUGT71C1 (NP_180536); ThF7GT (BAH14961); PfUGT57 (BAG31949); PfUGT50 (BAG31948); AmUGTcg10 (BAG31945); IpA3G2GT (BAD95882); SiF1G6GlcT (BAF99027); GmF7G2RhaT (Q8GVE3.2); AtA3G2XyIT (NP_200217); CsF7G6RhaT (NP_001275829); CmF3G6RhaT (NP_001275524); FtUFGT1 (KX216512); FtUFGT2 (KX216513); FtUFGT3 (KX216514)
Fig. 3
Fig. 3
Tissue-specific expression of FtUFGT genes in flowering stages of tartary buckwheat. (a) Heat map of FtUFGTs. Each column represents one tissue, each line represents one gene which are displayed at the right. Depths of color in the blue and red rectangles reflect lower and higher Z-scores for mRNA accumulations. (b) Expression pattern of FtUFGTs. FtH3 was used as a reference gene. The accumulation of FtUFGT6 mRNA in the root was defined at “1”. Means were calculated from three repeats, and error bars reflect ±SD
Fig. 4
Fig. 4
(a) Phenotypic of seedling transgenic plants and wild type. The seedlings of the transgenic plants and wild type were grown on 1/2 MS medium for 2 weeks. Red arrow represent where the color is deepened. (b) The total anthocyanin contents in transgenic plants and wild type. Each value represents the mean of three replicates, and error bars indicate standard deviations (±SD). * and ** represent significant differences between transgenic lines and WT at P < 0.05 and P < 0.01, respectively
Fig. 5
Fig. 5
The main flavonoid contents (rutin, quercetin, and myricetin) in transgenic plants and wild type. Each value represents the mean of three replicates, and error bars indicate standard deviations (±SD). * and ** represent significant differences between transgenic lines and WT at P < 0.05 and P < 0.01, respectively
Fig. 6
Fig. 6
Leaf size of transgenic plants and wild type. (a) The seedlings of the transgenic plants and wild type were grown on soil for about 40 days. The transgenic plants of FtUFGT6 and FtUFGT15 are marked with a red frame. (b) Leaf area was quantified by Image J software. Each value represents the mean of three replicates, and error bars indicate standard deviations (±SD). ** indicate a significant difference from that of WT at p < 0.01
Fig. 7
Fig. 7
Phenotype of transgenic plants and wild type. (a) The rosette phenotype of 40-day old transgenic plants. Red arrow highlights FtUFGT6 and FtUFGT15 transgenic plants. (b) The phenotype of transgenic plants at four different growth stages (47-day, 51-day, 57-day, and 64-day). (c) The plant height of FtUFGT6 and FtUFGT15 transgenic plants at four different growth stages (47-day, 51-day, 57-day, and 64-day). Each value represents the mean of three replicates, and error bars indicate standard deviations (±SD). *, **, and *** indicate a significant difference from that of WT at p < 0.05, p < 0.01, p < 0.001, respectively
Fig. 8
Fig. 8
The growth of oxFtUFGT6 and oxFtUFGT15 transgenic plants at seedling stage. (a) The seedlings were grown on 1/2 MS medium for a week. (b) The root phenotype of transgenic plants on 1/2 MS medium grown for a week. (c) The root length of transgenic plants. Each value represents the mean of three replicates, and error bars indicate standard deviations (±SD). ** indicate a significant difference from that of WT at p < 0.01

References

    1. Dixon RA, Paiva NL. Stress-induced phenylpropanoid metabolism. Plant Cell. 1995;7(7):1085–1097. doi: 10.2307/3870059. - DOI - PMC - PubMed
    1. Ferreyra MLF, Rius SP, Casati P: Flavonoids: biosynthesis, biological functions, and biotechnological applications. Front Plant Sci 2012, 3:222–222. - PMC - PubMed
    1. Middleton E, Kandaswami C, Theoharides TC. The effects of plant flavonoids on mammalian cells: implications for inflammation, heart disease, and cancer. Pharmacol Rev. 2000;52(4):673–751. - PubMed
    1. Wang H, Fan W, Li H, Yang J, Huang J, Zhang P. Functional characterization of dihydroflavonol-4-reductase in anthocyanin biosynthesis of purple sweet potato underlies the direct evidence of anthocyanins function against abiotic stresses. PLoS One. 2013;8(11):e78484. doi: 10.1371/journal.pone.0078484. - DOI - PMC - PubMed
    1. Baba SA, Mohiuddin T, Basu S, Swarnkar MK, Malik AH, Wani ZA, Abbas N, Singh AK, Ashraf N. Comprehensive transcriptome analysis of Crocus sativus for discovery and expression of genes involved in apocarotenoid biosynthesis. BMC Genomics. 2015;16(1):698. doi: 10.1186/s12864-015-1894-5. - DOI - PMC - PubMed

LinkOut - more resources