. 2019 Aug 5;16(1):163.
doi: 10.1186/s12974-019-1550-0.

Depletion of regulatory T cells increases T cell brain infiltration, reactive astrogliosis, and interferon-γ gene expression in acute experimental traumatic brain injury

Affiliations

Depletion of regulatory T cells increases T cell brain infiltration, reactive astrogliosis, and interferon-γ gene expression in acute experimental traumatic brain injury

Tobias J Krämer et al. J Neuroinflammation. .

Erratum in

Abstract

Background: Traumatic brain injury (TBI) is a major cause of death and disability. T cells were shown to infiltrate the brain during the first days after injury and to exacerbate tissue damage. The objective of this study was to investigate the hitherto unresolved role of immunosuppressive, regulatory T cells (Tregs) in experimental TBI.

Methods: "Depletion of regulatory T cell" (DEREG) and wild type (WT) C57Bl/6 mice, treated with diphtheria toxin (DTx) to deplete Tregs or to serve as control, were subjected to the controlled cortical impact (CCI) model of TBI. Neurological and motor deficits were examined until 5 days post-injury (dpi). At the 5 dpi endpoint, (immuno-) histological, protein, and gene expression analyses were carried out to evaluate the consequences of Tregs depletion. Comparison of parametric or non-parametric data between two groups was done using Student's t test or the Mann-Whitney U test. For multiple comparisons, p values were calculated by one-way or two-way ANOVA followed by specific post hoc tests.

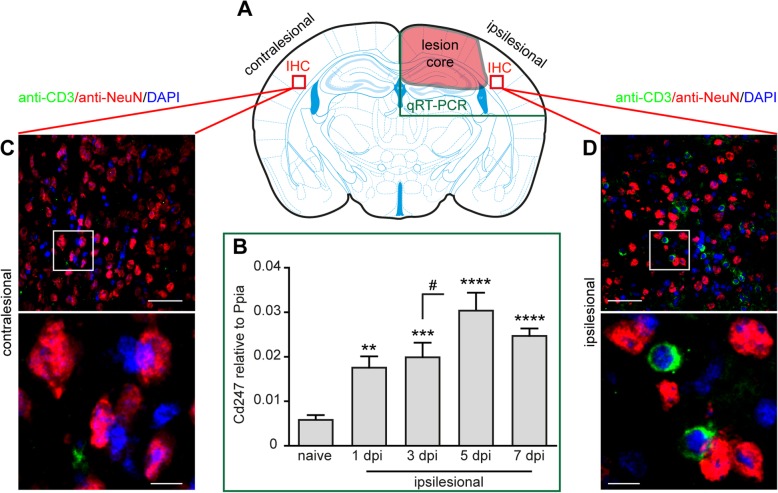
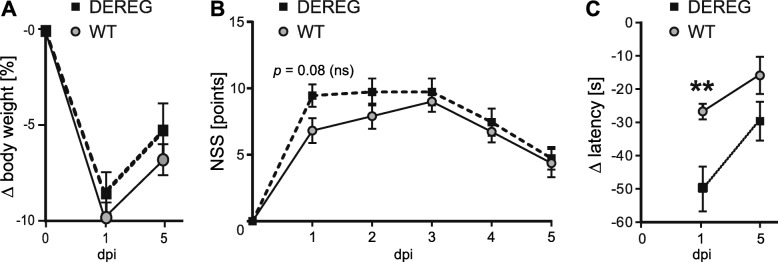
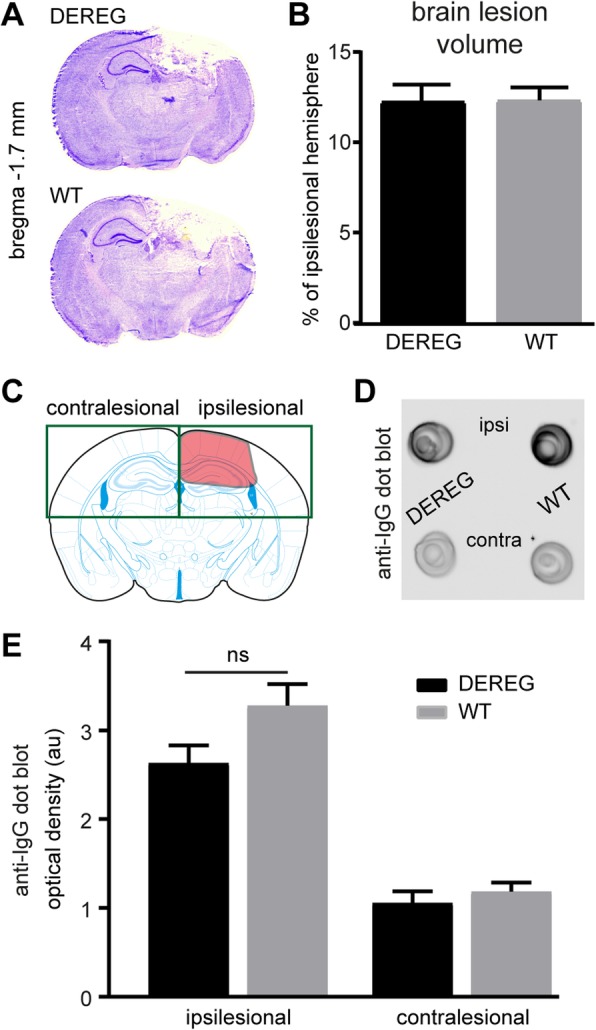
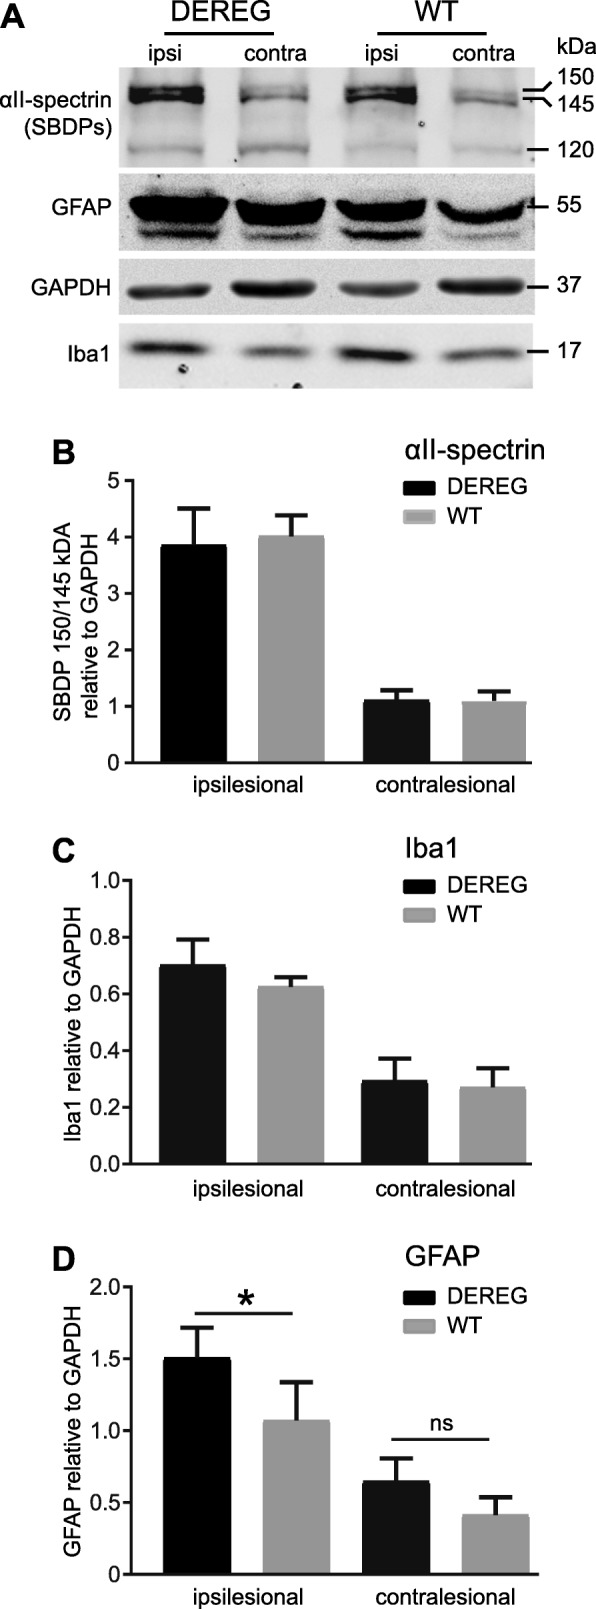
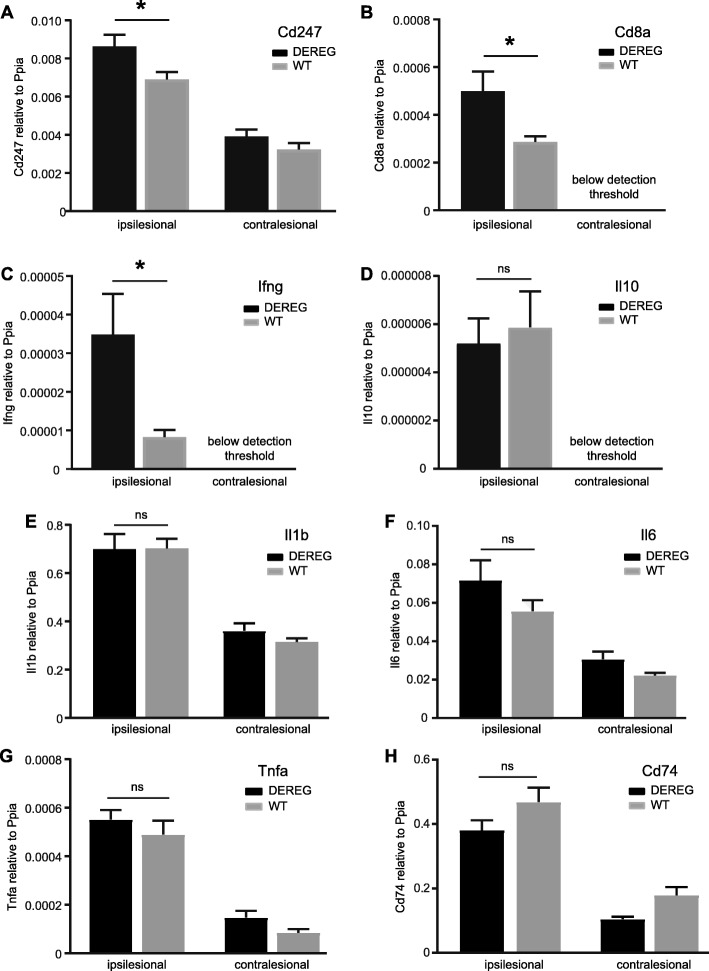
Results: The overall neurological outcome at 5 dpi was not different between DEREG and WT mice but more severe motor deficits occurred transiently at 1 dpi in DEREG mice. DEREG and WT mice did not differ in the extent of brain damage, blood-brain barrier (BBB) disruption, or neuronal excitotoxicity, as examined by lesion volumetry, immunoglobulin G (IgG) extravasation, or calpain-generated αII-spectrin breakdown products (SBDPs), respectively. In contrast, increased protein levels of glial fibrillary acidic protein (GFAP) and GFAP+ astrocytes in the ipsilesional brain tissue indicated exaggerated reactive astrogliosis in DEREG mice. T cell counts following anti-CD3 immunohistochemistry and gene expression analyses of Cd247 (CD3 subunit zeta) and Cd8a (CD8a) further indicated an increased number of T cells infiltrating the brain injury sites of DEREG mice compared to WT. These changes coincided with increased gene expression of pro-inflammatory interferon-γ (Ifng) in DEREG mice compared to WT in the injured brain.

Conclusions: The results show that the depletion of Tregs attenuates T cell brain infiltration, reactive astrogliosis, interferon-γ gene expression, and transiently motor deficits in murine acute traumatic brain injury.

Keywords: Astrocytes; Cytokines; Immune response; Inflammation; Microglia; T cells; Traumatic brain injury.


Conflict of interest statement

The authors declare that they have no competing interests.

Figures

Fig. 1
Fig. 1
CD3+ T cells infiltrate the injured brain tissue in acute experimental TBI. a Scheme illustrating the brain tissue regions examined by qRT-PCR (green box, compared to corresponding regions of naive brains) or immunohistochemistry (IHC, red boxes). b qRT-PCR time course analysis of Cd247 expression in the injured, ipsilesional brain tissue reveals peak expression at 5 dpi. c, d Double-immunostaining using anti-CD3 (green, pan T cell marker) and anti-NeuN (red, pan neuron marker), and DAPI staining (blue, nuclei). c CD3+ T cells were absent in the non-injured, contralesional hemisphere. d CD3+ T cells infiltrated the injured, ipsilesional brain tissue. Brain sections from five mice were examined by IHC at 5 dpi. Data are expressed as mean ± SEM (n = 9–10 per time point) and statistical significance was calculated by one-way ANOVA followed by Dunn’s multiple comparison test (**p < 0.01; ***p < 0.001; ****p < 0.0001; #p < 0.05). Scales: 100 μm, 20 μm (c, d)
Fig. 2
Fig. 2
DTx-mediated depletion of Tregs in DEREG mice. a FACS plot examples of blood lymphocyte gates from naive DEREG mice (control) or DTx-treated DEREG mice showing the lymphocyte populations for naive DEREG mice (control) and for DEREG + DTx at 5 days after the last DTx administration. b FACS plot examples showing CD4+ lymphocytes vs. FoxP3-GFP+ Tregs in blood samples from DEREG control mice and DEREG DTx-treated mice. c Histogram showing depletion of FoxP3-GFP+ Tregs in DTx-treated DEREG mice. Data represent mean ± SEM (n = 5–10) and statistical significance was calculated by Mann-Whitney U test (***p < 0.001)
Fig. 3
Fig. 3
Treg depletion did not affect the overall neurological outcome but transiently aggravated motor deficits after CCI. ac Body weight, neurological impairment (NSS), and rotarod performance of DEREG and WT mice (n = 11–12, each genotype). Body weight and rotarod performance are expressed as relative to pre-injury values (set to 0). a Relative body weight loss at 1 dpi and 5 dpi was similar between DEREG and WT mice. b NSS at 1–5 dpi were not significantly altered between DEREG and WT mice but DEREG mice showed a trend towards an increased NSS at 1 dpi (p = 0.08). c Motor deficits assessed by rotarod performance were transiently aggravated in DEREG at 1 dpi but not at 5 dpi compared to WT mice. Data are expressed as mean ± SEM. Statistical significance between DEREG and WT mice was calculated using two-way ANOVA followed by Sidak’s multiple comparison test (**p < 0.01)
Fig. 4
Fig. 4
DEREG mice exhibit no alterations in brain lesion size and IgG extravasation compared to WT mice after CCI. a Examples of cresyl violet-stained cryosections demonstrating the extent of unilateral brain damage at 5 dpi. b Brain lesion volume (percentage of ipsilesional hemisphere) was not altered between DEREG and WT mice (n = 11–12, Mann-Whitney U test). c Scheme illustrating the brain tissue regions collected for anti-IgG dot-blot immunoassay. d Example of dot-blot immunoassay using samples from ipsi- or contralesional brain tissues and probed with antibodies specific to mouse IgG. e IgG levels in ipsilesional brain tissues from DEREG and WT mice were not significantly (ns) different (Fig. 4e, p = 0.063, one-way ANOVA followed by Tukey’s multiple comparison test)
Fig. 5
Fig. 5
DEREG mice show similar induction of neuronal injury and microgliosis marker but elevated protein levels of the reactive astrocyte marker GFAP. a Western blot of brain lysates (37.5 μg protein/sample) from ipsi- and contralesional brain tissue. Blots were probed with antibodies specific to αII-spectrin, Iba1, GFAP, or GAPDH. b CCI induces the generation of αII-spectrin breakdown products of 150 kDa, and 145 kDa in the ipsilesional brain tissue. The 120 kDa αII-spectrin fragment was not altered by CCI. No differences were found between DTx-treated DEREG mice compared to WT. c Protein expression of the microglia marker Iba1 appeared increased in the ipsilesional brain tissue after CCI. There were no alterations between DEREG and WT mice. d GFAP was induced by CCI in the ipsilesional brain tissue. Increased GFAP protein levels were found in DEREG mice compared to WT. Data are expressed as mean ± SEM, n = 11 per group, *p < 0.05, one-way ANOVA followed by Tukey’s multiple comparison test
Fig. 6
Fig. 6
DEREG mice develop exaggerated astrogliosis after CCI. a, b Images showing details of brain cryosections after immunostaining with anti-Iba1 (a) or anti-GFAP (b) to label microglia/macrophages or reactive astrocytes in the contralesional or ipsilesional cortex at 5 dpi, respectively. Images were processed for digital cell recognition after thresholding. c, d Histograms showing the numbers of Iba1 IR cells or GFAP IR cells per mm2. GFAP IR cells were markedly increased in ipsilesional brain parenchyma of DEREG compared to WT mice. Data are expressed as mean ± SEM, n = 11 per group, ****p < 0.0001, one-way ANOVA followed by Tukey’s multiple comparison test. Scale 100 μm (b)
Fig. 7
Fig. 7
T cell infiltration of the injured brain tissue is increased in DEREG mice. a Scheme illustrating the perilesional regions (gray) containing infiltrations of CD3 IR T cells. b Double-immunofluorescence images of cryosections showing CD3 IR T cells (green) infiltrating the injured perilesional brain parenchyma as indicated by the presence of GFAP IR astrocytes (red) at 5 dpi. c Histogram showing the mean number of CD3 IR cells infiltrating the brain parenchyma per brain section. Statistical significance was calculated by Mann-Whitney U test (**p < 0.01). Scale 100 μm (b)
Fig. 8
Fig. 8
Increased gene expression of T cell marker and IFN-γ in the brain tissue from DEREG mice after CCI. ah Histograms showing mRNA expression of T cell marker genes (Cd247, Cd8a) and inflammatory marker genes (Ifng, Il10, Il1b, Il-6, Tnfa, and Cd74) in WT and DEREG mice as determined by qRT-PCR at 5 dpi. Data from ipsilesional and contralesional brain tissue samples are shown. bd Note that Cd8a, Ifng, and Il10 gene expression levels in the contralesional brain tissue samples were below the detection threshold. Data are expressed as mean ± SEM, and p values were calculated by Student’s t test (bd; *p < 0.05) or by one-way ANOVA followed by multiple comparison using Tukey’s or Dunn’s post hoc test (a, eh, *p < 0.05)

References

    1. Maas AIR, Menon DK, Adelson PD, Andelic N, Bell MJ, Belli A, et al. Traumatic brain injury: integrated approaches to improve prevention, clinical care, and research. Lancet Neurol. 2017;16(12):987–1048. - PubMed
    1. Werner C, Engelhard K. Pathophysiology of traumatic brain injury. Br J Anaesth. 2007;99(1):4–9. - PubMed
    1. Schäfer MK, Pfeiffer A, Jaeckel M, Pouya A, Dolga AM, Methner A. Regulators of mitochondrial Ca (2+) homeostasis in cerebral ischemia. Cell Tissue Res. 2014;357(2):395–405. - PubMed
    1. Toklu HZ, Tumer N. Oxidative stress, brain edema, blood-brain barrier permeability, and autonomic dysfunction from traumatic brain injury. 2015. - PubMed
    1. Pearn ML, Niesman IR, Egawa J, Sawada A, Almenar-Queralt A, Shah SB, et al. Pathophysiology associated with traumatic brain injury: current treatments and potential novel therapeutics. Cell Mol Neurobiol. 2017;37(4):571–585. - PMC - PubMed

MeSH terms

Substances