. 2019 Aug:46:356-367.
doi: 10.1016/j.ebiom.2019.07.037. Epub 2019 Aug 2.

Bioavailability and cytosolic kinases modulate response to deoxynucleoside therapy in TK2 deficiency

Affiliations

Bioavailability and cytosolic kinases modulate response to deoxynucleoside therapy in TK2 deficiency

Carlos Lopez-Gomez et al. EBioMedicine. 2019 Aug.

Abstract

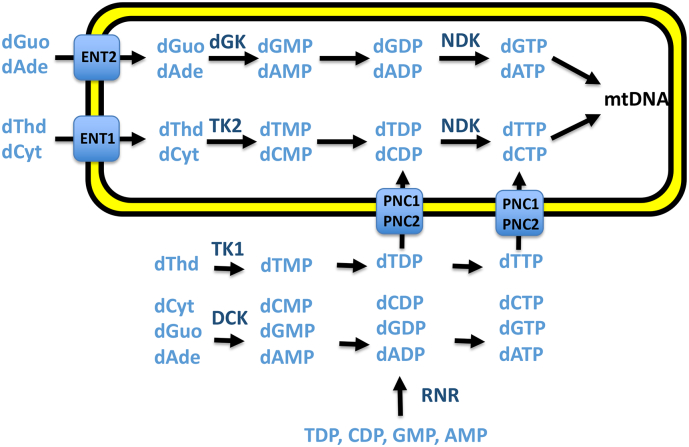
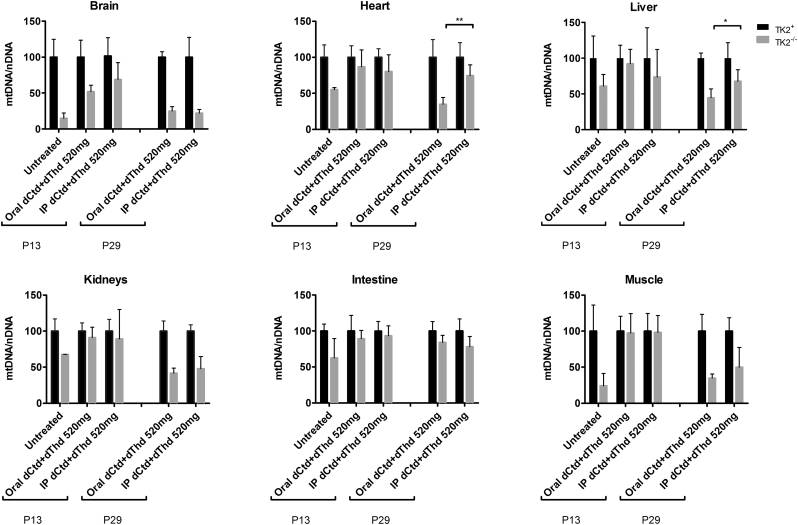
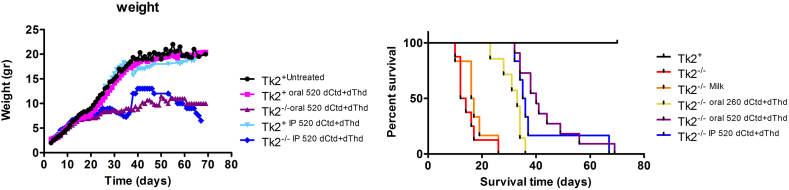
Background: TK2 is a nuclear gene encoding the mitochondrial matrix protein thymidine kinase 2 (TK2), a critical enzyme in the mitochondrial nucleotide salvage pathway. Deficiency of TK2 activity causes mitochondrial DNA (mtDNA) depletion, which in humans manifests predominantly as a mitochondrial myopathy with onset typically in infancy and childhood. We previously showed that oral treatment of the Tk2 H126N knock-in mouse model (Tk2-/-) with the TK2 substrates, deoxycytidine (dCtd) and thymidine (dThd), delayed disease onset and prolonged median survival by 3-fold. Nevertheless, dCtd + dThd treated Tk2-/- mice showed mtDNA depletion in brain as early as postnatal day 13 and in virtually all other tissues at age 29 days.

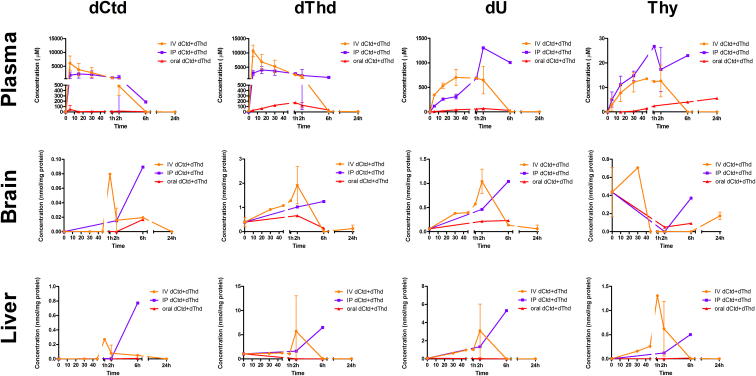
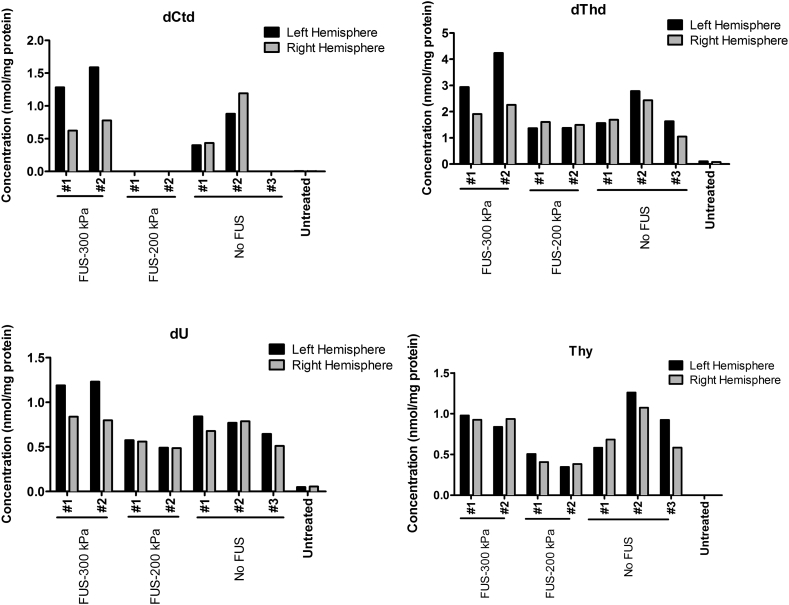
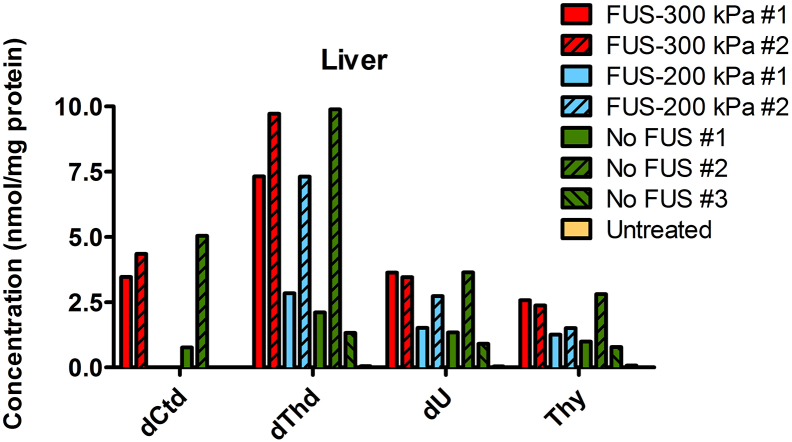
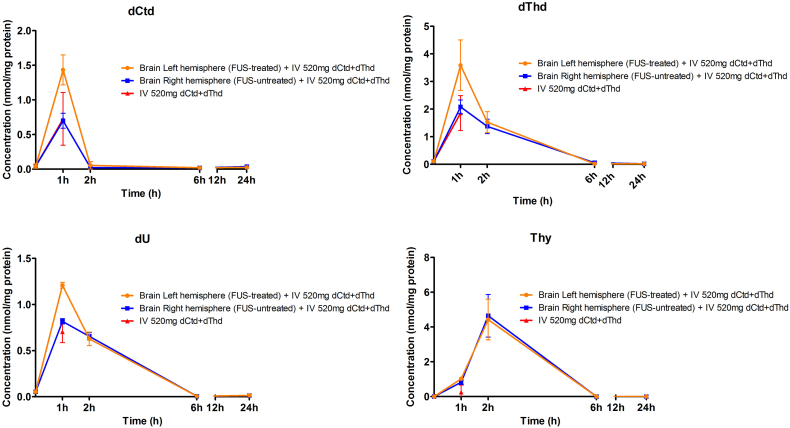
Methods: To enhance mechanistic understanding and efficacy of dCtd + dThd therapy, we studied the bioavailability of dCtd and dThd in various tissues as well as levels of the cytosolic enzymes, TK1 and dCK that convert the deoxynucleosides into dCMP and dTMP.

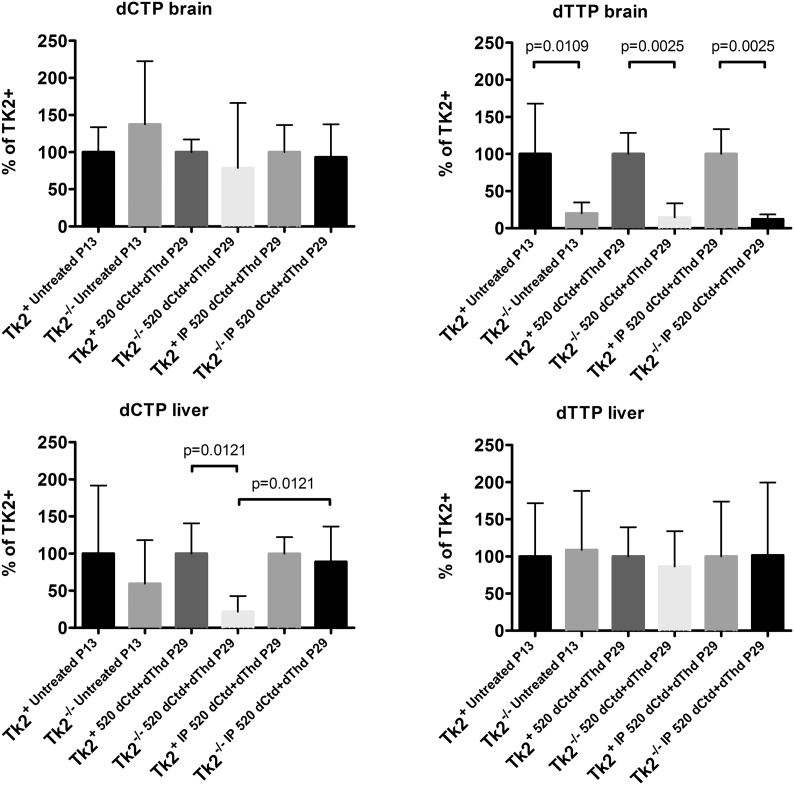
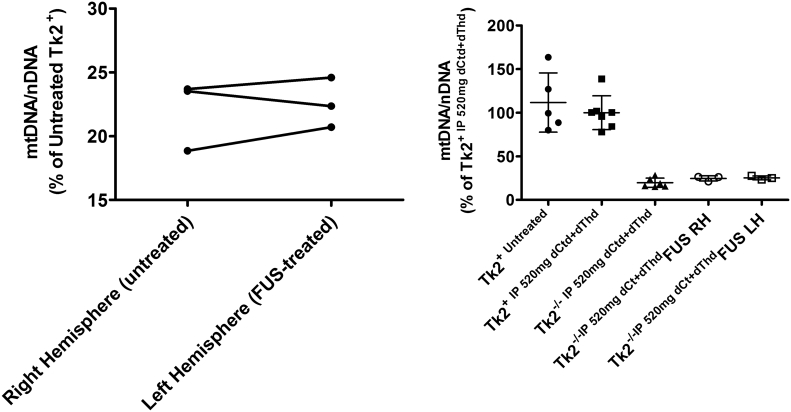
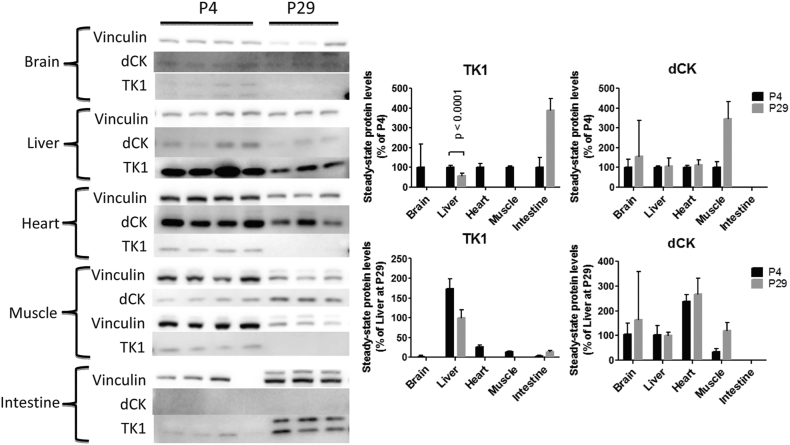
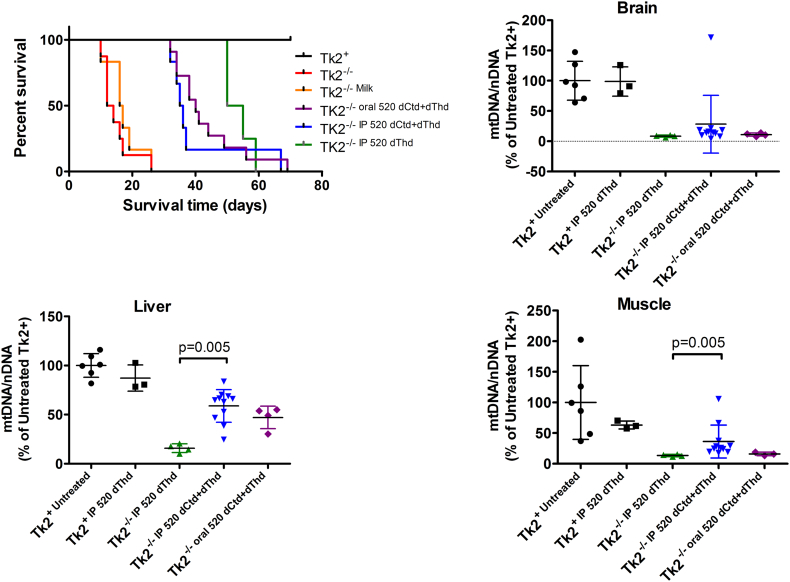
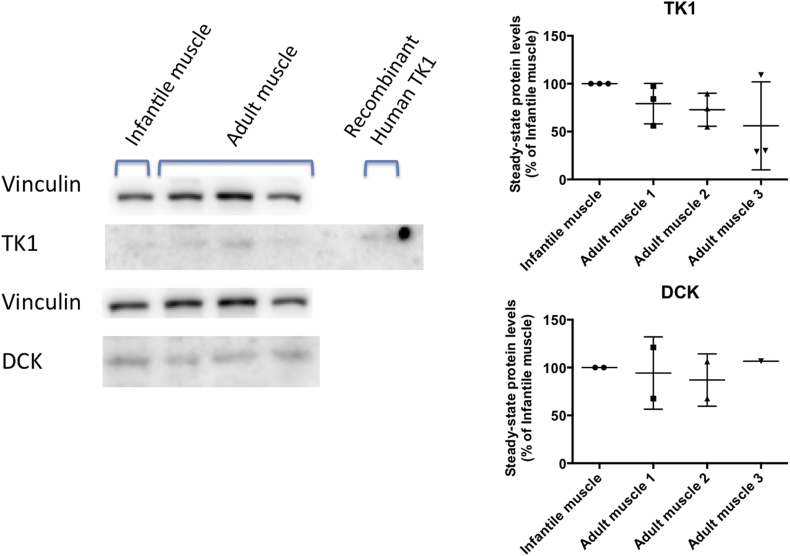
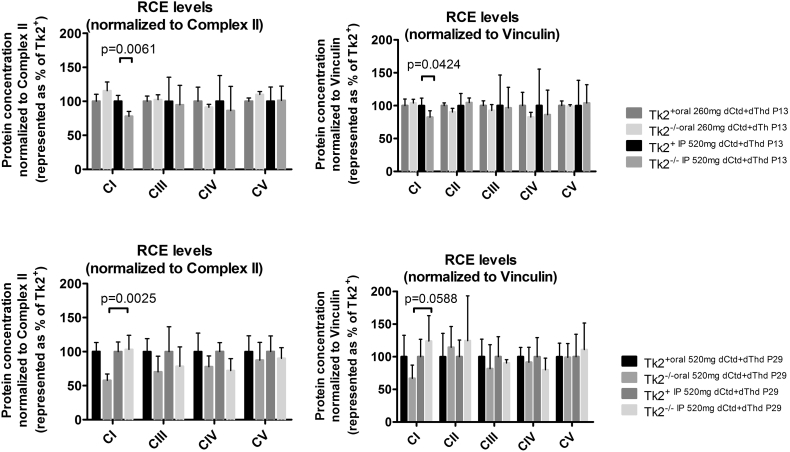
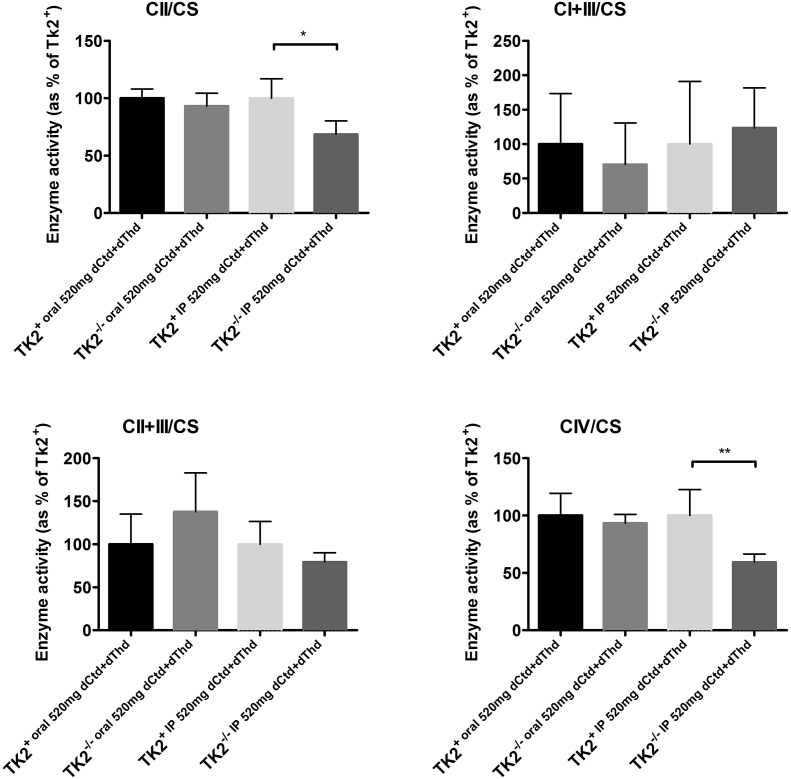
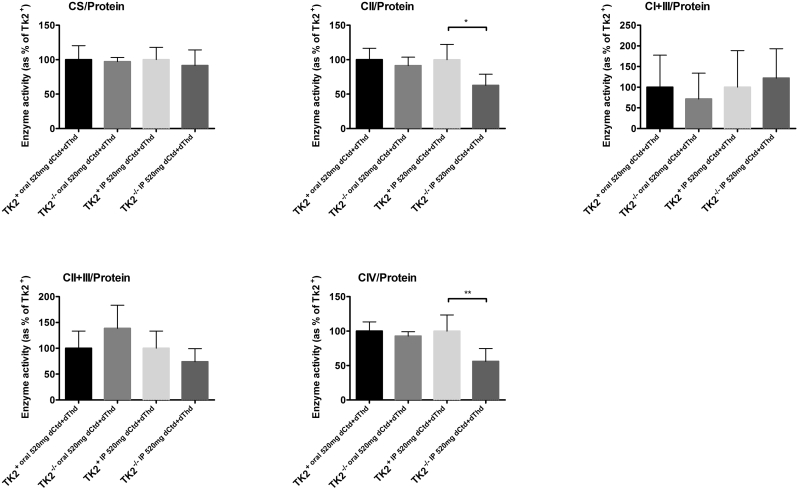
Findings: Parenteral treatment relative to oral treatment produced higher levels of dCtd and dThd and improved mtDNA levels in liver and heart, but did not ameliorate molecular defects in brain or prolong survival. Down-regulation of TK1 correlated with temporal- and tissue-specificity of response to dCtd + dThd. Finally, we observed in human infant and adult muscle expression of TK1 and dCK, which account for the long-term efficacy to dCtd + dThd therapy in TK2 deficient patients.

Interpretations: These data indicate that the cytosolic pyrimidine salvage pathway enzymes TK1 and dCK are critical for therapeutic efficacy of deoxynucleoside therapy for Tk2 deficiency. FUND: National Institutes of Health P01HD32062.

Keywords: Deoxycytidine; Nucleoside; TK2; Thymidine; Thymidine kinase 2; mtDNA depletion syndrome.


Conflict of interest statement

MH is a co-inventor on a patent application for deoxynucleoside therapies for mitochondrial DNA depletion syndrome including TK2 deficiency. Columbia University Irving Medical Center (CUIMC) has licensed the pending patent applications related to the technology to Modis Therapeutics, Inc. (formerly Meves Pharmaceuticals, Inc.) and CUIMC may be eligible to receive payments related to the development and commercialization of the technology. MH is a paid consultant to Modis Therapeutics, Inc. This relationship is de minimus for Columbia University Medical Center (MH). The other authors declare no conflicts of interest.

Figures

Fig. 1
Fig. 1
Deoxynucleotide salvage and de novo synthesis pathways. In the deoxynucleotide salvage pathways, thymidine (dThd) is phosphorylated by thymidine kinase 1 (TK1) in cytosol and by thymidine kinase 2 (TK2) in mitochondria. In contrast, deoxycytidine (dCtd) is phosphorylated by deoxycytidine kinase (DCK) in cytosol and by TK2 in mitochondria. The purine nucleosides are phosphorylated by DCK in cytosol and by deoxyguanoside kinase (DGK) in mitochondria. In the de novo pathway, ribonucleoside diphosphates are converted to deoxynucleoside diphosphates by ribonucleotide reductase (RNR). Equilibrative nucleoside transporter 1 (ENT1) and 2 (ENT2) transport pyrimidine and purine nucleosides across mitochondrial membranes. Purine and pyrimidine nucleotide carrier 1 (PNC1) and 2 (PNC2) transport deoxynucleoside diphosphates and deoxynucleoside triphosphates across mitochondrial membranes.
Fig. 2
Fig. 2
Pharmacokinetics of dCtd + dThd treatment. Concentration of dCtd (deoxycytidine), dThd (thymidine), dU (deoxyuridine) and thymine after administration of 520 mg/kg of dCtd + dThd using oral gavage (red line) intra-peritoneal injection (blue line) or intra-venous injection (orange line). Concentrations are either as μM (plasma) or nmol/mg of protein (tissues). Time points < 1 h after treatment are represented in minutes. (For interpretation of the references to colour in this figure legend, the reader is referred to the web version of this article.)
Fig. 3
Fig. 3
Levels of dCTP and dTTP in brain and liver. Values are expressed as percents of levels in Tk2+mice for each treatment. P values < .05 by Mann Whitney tests comparing dNTP levels in Tk2+versus Tk2−/−mice within each treatment are indicated.
Fig. 4
Fig. 4
Levels of Mitochondrial DNA. Values are represented as percents of mtDNA levels in Tk2+ mice within each treatment. P values < 0·05 (*) or <0·01 (**) from Mann Whitney tests between orally- and IP-treated Tk2−/−are indicated.
Fig. 5
Fig. 5
Levels of dCtd and dThd in brain after FUS-induced BBB opening. FUS was performed in two mice using 300 kPa and two additional mice using 200 kPa, while three mice used as controls (“No FUS” controls). Treatment with 520 mg/kg of dCtd + dThd via intravenous injection was followed in all seven mice, and one additional mouse was left without treatment as an “Untreated” control.
Fig. 6
Fig. 6
mtDNA levels in FUS-treated mice. Left panel: mtDNA levels in right (untreated) and left (treated) hemisphere from Tk2−/−. Lines connect values from each mouse brain. Values are expressed as percents of mtDNA level in Tk2+ mice. Right panel: Values are expressed as percents of of mtDNA level in Tk2+ mice treated with 520 mg/kg/day of dCtd + dThd via IP injection. RH and LH denotes right hemisphere and left hemisphere, respectively.
Fig. 7
Fig. 7
TK1 and dCK levels in mice. Right panel: Immunoblots showing bands corresponding to vinculin (loading control, 130 KDa), TK1 (26 KDa) and dCK (30 KDa). Four first lanes correspond to tissues from mice euthanized at age 4 days and three last lanes correspond to tissues from mice euthanized at age 29 days. Blots have been cropped to improve visualization. Negative controls and molecular size markers were loaded on each immunoblot. Left panel: Quantification of immunoblots from right panel. Vinculin was used as loading control to normalize values from TK1 and dCK bands within each lane. Values are expressed either as percentage of the average value at age 4 days within each tissue or as percentage of the average in liver at age 29 days.
Fig. 8
Fig. 8
Survival and mtDNA levels after dThd treatment. Upper left graph represents survival, represented as percent survival within each treatment group, of Tk2−/− mice. Remaining graphs represent mtDNA levels in brain, liver, and muscle. Values as expressed as percents of mtDNA in untreated Tk2+ mice. P values < .05 from Mann Whitney tests between dCtd + dThd- and dThd-treated Tk2−/−mice are indicated.
Fig. 9
Fig. 9
TK1 and dCK levels in human. Left panel: Representative immunoblots showing bands corresponding to TK1, dCK, and vinculin. The far left lane is loaded with muscle protein extract from an infant subject, three adjacent lanes are loaded with muscle protein extract from three adult subjects and the far right lane is loaded with human recombinant TK1 (Novoprotein Catalog # CI64 10 μg) as positive control. Right panel: Quantitation of TK1 (upper graph) and dCK (lower graph). Vinculin was used as loading control to normalize values from TK1 and dCK bands within each lane. Values are expressed as percents of levels in the infantile subject sample.
Supplementary Fig. 1
Protein levels of the mitochondrial respiratory chain complexes. Brain extracts from mice euthanized either at age 13 days (upper graphs) or 29 days old (lower graphs) were loaded. Values were normalized using either complex II (left) or vinculin (right). P values of Mann Whitney tests are represented as one (p < 0·05), two (p < 0·01), three (p < 0·001) or four (p < 0·0001) stars.
Supplementary Fig. 2
Mitochondrial OxPhos enzyme activities normalized to CS activity. Values are expressed as percentage of the Tk2+ mice treated with dCtd + dThd via IP injection. P values of Mann Whitney tests are represented as one (p < 0·05), two (p < 0·01) stars.
Supplementary Fig. 3
Mitochondrial OxPhos enzyme activities at age 29 days normalized to protein concentration. Values are expressed as percentage of the Tk2+ mice treated with dCtd + dThd via IP injection. P values of Mann Whitney tests are represented as one (p < 0·05), two (p < 0·01) stars.
Supplementary Fig. 4
Weight and survival of Tk2−/− mice treated with dCtd + dThd via IP. Weight (left panel) is expressed as the average weight in grams each day. Survival (right panel) is represented as percent survival within each treatment group.
Supplementary Fig. 5
Assessments of FUS-induced BBB disruption. Inertial cavitation dose (ICD) and stable cavitation dose from harmonics (SCDh) and ultraharmonics (SCDu), Different pressures (225, 300 and 450 kPa) were assessed using full or half dose of lipid-coated micro bubbles and with (Nc) or without (No Nc) dCtd + dThd treatment.
Supplementary Fig. 6
Levels of dCtd and dThd in liver after FUS-induced BBB opening. FUS was performed in two mice using 300 kPa and two additional mice using 200 kPa, while three mice were left as controls (“No FUS” controls). Treatment with 520 mg/kg of dCtd + dThd via intravenous injection was followed in all seven mice, and one additional “Untreated” mouse control.
Supplementary Fig. 7
Pharmacokinetics of dCtd + dThd treatment after FUS-treatment. Concentrations of dCtd (deoxycytidine), dThd (thymidine), dU (deoxyuridine) and Thymine after FUS followed by administration of 520 mg/kg of dCtd + dThd using intra-venous injection. Concentrations are expressed as nmol/mg of protein (tissues).

Comment in

Similar articles

Cited by

References

    1. Wang L. Mitochondrial purine and pyrimidine metabolism and beyond. Nucleosides Nucleotides Nucleic Acids. 2016;35(10−12):578–594. - PubMed
    1. Saada A., Shaag A., Mandel H., Nevo Y., Eriksson S., Elpeleg O. Mutant mitochondrial thymidine kinase in mitochondrial DNA depletion myopathy. Nat Genet. 2001;29(3):342–344. - PubMed
    1. Saada A., Ben-Shalom E., Zyslin R., Miller C., Mandel H., Elpeleg O. Mitochondrial deoxyribonucleoside triphosphate pools in thymidine kinase 2 deficiency. Biochem Biophys Res Commun. 2003;310(3):963–966. - PubMed
    1. Behin A., Jardel C., Claeys K.G. Adult cases of mitochondrial DNA depletion due to TK2 defect: an expanding spectrum. Neurology. 2012;78(9):644–648. - PubMed
    1. Garone C., Taylor R.W., Nascimento A. Retrospective natural history of thymidine kinase 2 deficiency. J Med Genet. 2018;55(8):515–521. - PMC - PubMed

MeSH terms