. 2019 Oct 3;134(14):1176-1189.
doi: 10.1182/blood.2019000578. Epub 2019 Aug 5.

PHF19 promotes multiple myeloma tumorigenicity through PRC2 activation and broad H3K27me3 domain formation

Affiliations

PHF19 promotes multiple myeloma tumorigenicity through PRC2 activation and broad H3K27me3 domain formation

Zhihong Ren et al. Blood. .

Abstract

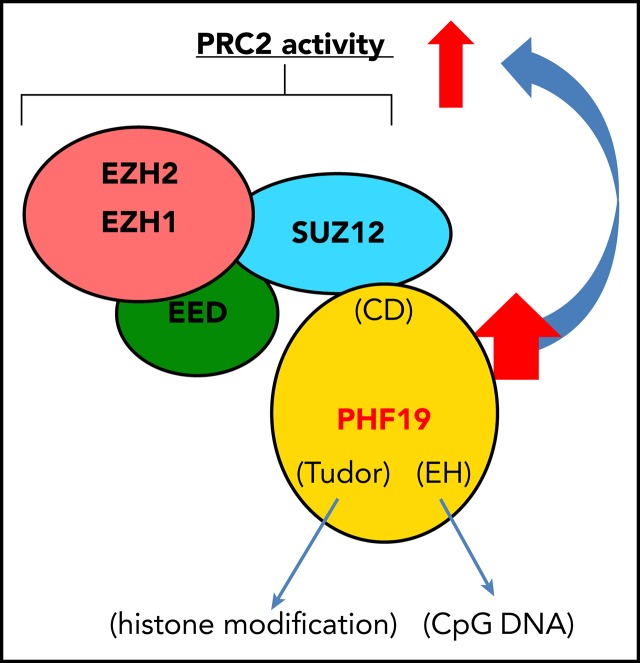
Dysregulation of polycomb repressive complex 2 (PRC2) promotes oncogenesis partly through its enzymatic function for inducing trimethylation of histone H3 lysine 27 (H3K27me3). However, it remains to be determined how PRC2 activity is regulated in normal and diseased settings. We here report a PRC2-associated cofactor, PHD finger protein 19 (PHF19; also known as polycomb-like 3), as a crucial mediator of tumorigenicity in multiple myeloma (MM). Overexpression and/or genomic amplification of PHF19 is found associated with malignant progression of MM and plasma cell leukemia, correlating to worse treatment outcomes. Using various MM models, we demonstrated a critical requirement of PHF19 for tumor growth in vitro and in vivo. Mechanistically, PHF19-mediated oncogenic effect relies on its PRC2-interacting and chromatin-binding functions. Chromatin immunoprecipitation followed by sequencing profiling showed a critical role for PHF19 in maintaining the H3K27me3 landscape. PHF19 depletion led to loss of broad H3K27me3 domains, possibly due to impaired H3K27me3 spreading from cytosine guanine dinucleotide islands, which is reminiscent to the reported effect of an "onco"-histone mutation, H3K27 to methionine (H3K27M). RNA-sequencing-based transcriptome profiling in MM lines also demonstrated a requirement of PHF19 for optimal silencing of PRC2 targets, which include cell cycle inhibitors and interferon-JAK-STAT signaling genes critically involved in tumor suppression. Correlation studies using patient sample data sets further support a clinical relevance of the PHF19-regulated pathways. Lastly, we show that MM cells are generally sensitive to PRC2 inhibitors. Collectively, this study demonstrates that PHF19 promotes MM tumorigenesis through enhancing H3K27me3 deposition and PRC2's gene-regulatory functions, lending support for PRC2 blockade as a means for MM therapeutics.


Conflict of interest statement

Conflict-of-interest disclosure: The authors declare no competing financial interests.

Figures

None
Graphical abstract
Figure 1.
Figure 1.
Overexpression of PHF19 is correlated with malignant progression and adverse clinical outcomes of MM patients. (A) PHF19 expression in MM, relative to other indicated cancers, according to the Cancer Cell Line Encyclopedia data set. AML, acute myeloid leukemia; T-ALL, T-cell acute lymphoblastic leukemia. *P < .05; **P < .01; ***P < .001; ****P < .0001. (B-C) PHF19 expression in samples from normal controls or patients diagnosed with monoclonal gammopathy of undetermined significance (MGUS), smoldering MM (SMM), MM, or PCL in the indicated data sets. (D) Copy-number variation of the indicated gene in MM patients (National Center for Biotechnology Information Gene Expression Omnibus data set GSE21349). (E) PHF19 expression in MM patients, either at baseline or after disease relapse, based on the indicated data set. (F-G) Kaplan-Meier survival curve for PHF19 expression in the Mulligan et al cohort of relapsed MM patients (F; n = 264) receiving the trial of bortezomib and the Heuck et al cohort of relapsed MM patients (G; n = 55) receiving the Total Therapy 6 (TT6) regimen. NS, not significant.
Figure 2.
Figure 2.
PHF19 is essential for MM cell growth in vitro. (A) Domain structure of PHF19 isoforms. Red lines indicate the used shRNAs. (B-C) Immunoblots (B) and reverse transcription (RT) followed by qPCR (C) of PHF19 after shRNA-induced KD in L-363 cells. (D-I) Growth of L-363 (D), MM1.S (E), RPMI-8226 (F), NCI-H929 (G), KMS11 (H), and U266 (I) cells after transduction of the indicated shRNA relative to empty vector (EV). (J) Immunoblots of the indicated Flag-tagged PHF19 isoform used for rescuing PHF19 KD in L-363 cells. (K-L) Growth of PHF19-KD L-363 (K) or MM1.S (L) cells after rescue with either EV or the indicated PHF19 isoform, compared with parental WT cells. (M-O) Growth (M) of the indicated MM cells stably transduced with a PHF19-targeting sgRNA (sg) and doxycycline (Dox)-inducible Cas9, following treatment with doxycycline relative to mock. Cas9/sg-mediated genomic editing of PHF19 was verified by immunoblotting (N) and sequencing (O). (P-S) Colony-formation assays using KMS11 (P-Q; representative colony images shown in panel P), RMPI-8226 (R), or NIH-3T3 cells (S) after stable transduction of the indicated shRNA and/or gene. (T) Growth of K562 or Raji cells after transduction of the indicated shRNA relative to mock. KO, knockout; PAM, protospacer adjacent motif.
Figure 3.
Figure 3.
PHF19 is required for MM tumorigenesis in vivo. (A-C) Kaplan-Meier curve showing the event-free survival of NSG mice xenografted with the luciferase-labeled MM1.S cells that stably expressed a doxycyline-inducible, PHF19-specific shRNA (sh1254_Tet-on). Seven days after injection of cells via tail vein, mice were randomized into 2 cohorts, with one subjected to vehicle treatment as control and the other to doxycycline (Dox) as the PHF19-KD cohort, followed by weekly measurement of chemiluminescence signals (representative image and summary of signals shown in panels B and C, respectively). (D) Wright-Giemsa staining of the bone marrow samples prepared 8 weeks after xenograft of MM1.S cells into NSG mice, either mock treated (vehicle) or with PHF19 KD (Dox). Scale bar, 10 μM. (E-G) Kaplan-Meier curve for the event-free survival (E), representative image (F; 30 days postxenograft), and summary of chemiluminescence signals (G) of mice xenografted with the luciferase-labeled L-363 cells that stably expressed either empty vector (shEV), a PHF19-specific shRNA (sh1254), or sh1254 plus an sh1254-resistant PHF19 cDNA (sh1254+PHF19). n, cohort size.
Figure 4.
Figure 4.
PHF19 potentiates the PRC2-catalyzed H3K27me3 in MM. (A-B) Mass spectrometry (A) and immunoblotting (B) analyses of the indicated histone modifications in L-363 cells following mock treatment (shEV), PHF19 KD (sh1254), or PHF19-KD rescue (sh1254+PHF19). (C-E) Heatmap (C) and the averaged H3K27me3 ChIP-seq read densities (D-E) at the H3K27me3 peaks called in L-363 cells with mock treatment (shEV) or PHF19-KD (shPHF19), grouped into peaks at promoter (C, left, and D) and nonpromoter regions (C, right, and E). Shown on each row of heatmap is ChIP-seq read density across ±5 kb from the center of a called peak, with columns sorted by the H3K27me3 signals in mock-treated cells. Data shown here used reads sampled to the same sequencing depth. (F-G) Integrative Genomics Viewer views of H3K27me3 ChIP-seq read densities at genomic regions covering the CDKN1C-KCNQ1 (F) and STAT5B/5A/3 loci (G) in L-363 cells, either mock treated (shEV) or with PHF19-KD (shPHF19), and WT MM1.S and KMS11 cells. Bottom of the panels shows distribution of CGI elements (black bars). (H) Summary of the total number of H3K27me3 peaks, detected at genomic regions with (red) or without (blue) CGI, in L-363 cells stably expressed with shEV or shPHF19. (I) Venn diagram showing H3K27me3 peaks in WT KMS11 and L363 cells. (J) H3K27me3 ChIP-qPCR for the indicated gene promoter in L-363, MM1.S, and KMS11 cells stably transduced with shEV or shPHF19. Y-axis shows the average ± standard error (SE) of signals from 3 independent experiments after normalization to input. *P < .05; **P < .01.
Figure 5.
Figure 5.
Physical interaction with PRC2 is required for PHF19 to promote MM tumorigenesis. (A-B) CoIP for interaction of Flag-tagged PHF19 (A) or PHF1 (B), either WT or ΔCD, with endogenous EZH2 and SUZ12 in 293 cells. (C) Immunofluorescence of the indicated Flag-PHF19 in L-363 cells. Scale bar, 5 μM. (D-F) Growth of the indicated PHF19-KD MM cells after transduction of EV or the WT or ΔCD PHF19, relative to parental cells, in liquid culture (D-E) or soft agar–based (F) assays. (G-I) Kaplan-Meier curve of event-free survival (G), chemiluminescence signals (H), and representative imaging (I; 8 weeks after xenograft) of NSG mice xenografted with the PHF19-KD L-363 cells after rescue with EV or sh1254-resistant PHF19, either WT or ΔCD. (J-M) GSEA shows that higher PHF19 expression is negatively correlated with expression of genes directly bound by H3K27me3 (J) or repressed by EZH2 (K) or EED (L) and positively related to genes displaying positive correlation to EED (M) in 264 of MM patients, with the cohort divided to PHF19-high (top 50%) and PHF19-low (bottom 50%) based on a transcriptome data set (GSE9782).
Figure 6.
Figure 6.
Transcriptome profiling of MM cell lines and primary patient samples delineated the PHF19-enforced gene pathways crucial for MM tumorigenesis. (A) Heatmap showing relative expression of 2366 genes identified as both derepressed post-KD of PHF19 and re-repressed after rescue of PHF19-KD in MM1.S cells. Threshold of differential expression is adjusted DESeq P value (adj.p) of .01 and fold-change (FC) of 2 for transcripts with mean tag counts of ≥10. (B-G) GSEA reveals that, in MM1.S cells, PHF19 is correlated positively to the indicated gene sets showing positive association with EZH2 (B) or EED (C), negatively to the indicated EED-suppressed genes (D), and positively to genes related to cell cycle progression (E), E2F (F), and a proliferation phenotype (G). NES, normalized enrichment score. (H-I) GSEA using a MM patient sample transcriptome data set (GSE9782) shows that higher PHF19 expression is positively related to genes associated with cell cycle progression (H) or E2F (I). (J) Cell cycle progression of MM1.S cells after transduction of shEV (left) or shPHF19 (right). (K) RT-qPCR measures fold change in expression of the indicated cell cycle inhibitor gene in L-363, MM1.S, and NCI-H929 cells after transduction of shPHF19, relative to shEV. Y-axis shows average ± SE of values from three independent experiments. #, not examined due to gene deletion in cells. (L-M) GSEA reveals PHF19 KD positively correlated to gene sets related to the interferon signaling in MM1.S cells. (N) RT-qPCR measures fold change in expression of the indicated JAK/STAT signaling gene in L-363, MM1.S, and NCI-H929 cells after transduction of shPHF19 relative to shEV. (O) L-363 cell growth after transduction of STAT1 (red) or shPHF19 (red) relative to mock treated. Inset shows an immunoblot of the ectopically expressed STAT1.
Figure 7.
Figure 7.
PHF19’s chromatin-associating domains are essential for PHF19-mediated gene-repressive and tumorigenic effects in MM. (A) Immunoblotting of the indicated Flag-PHF19 in L-363 cells. (B-C) Growth of the PHF19-KD L-363 (B) or MM1.S (C) cells after transduction of EV, WT PHF19, or the indicated Tudor or EH mutant relative to WT cells. (D) RT-qPCR for the indicated gene in the PHF19-KD L-363 cells after transduction of EV, WT PHF19, or the indicated mutant. Y-axis shows the average ± SE of signals from three independent experiments after normalization to β-actin. *P < .05; **P < .01; ***P < .001; ****P < .0001. (E-G) Representative chemiluminescence imaging (E; 8 weeks postxenograft), signal summary (F), and event-free survival (G) of NSG mice postxenograft of the PHF19-KD L-363 cells after rescue with EV, WT PHF19, or the indicated mutant (cohort size, n = 5). (H) Growth of the indicated MM cells treated with UNC1999, relative to dimethyl sulfoxide (DMSO), for 4, 8, 12, or 16 days. (I-K) Chemiluminescence imaging (I-J; with representative imaging 5 weeks postxenograft shown in panel J) and Kaplan-Meier curve showing event-free survival (K) of NSG mice after xenograft of the luciferase-labeled L-363 cells and subsequent treatment with UNC1999 or vehicle.

Comment in

  • Myeloma's sound of silencing.
    Boise LH. Boise LH. Blood. 2019 Oct 3;134(14):1116-1117. doi: 10.1182/blood.2019002742. Blood. 2019. PMID: 31582370 No abstract available.

Similar articles

Cited by

References

    1. Cao R, Wang L, Wang H, et al. . Role of histone H3 lysine 27 methylation in Polycomb-group silencing. Science. 2002;298(5595):1039-1043. - PubMed
    1. Margueron R, Reinberg D. The Polycomb complex PRC2 and its mark in life. Nature. 2011;469(7330):343-349. - PMC - PubMed
    1. Di Croce L, Helin K. Transcriptional regulation by Polycomb group proteins. Nat Struct Mol Biol. 2013;20(10):1147-1155. - PubMed
    1. Xu B, Konze KD, Jin J, Wang GG. Targeting EZH2 and PRC2 dependence as novel anticancer therapy. Exp Hematol. 2015;43(8):698-712. - PMC - PubMed
    1. Jiao L, Liu X. Structural basis of histone H3K27 trimethylation by an active polycomb repressive complex 2. Science. 2015;350(6258):aac4383. - PMC - PubMed

Publication types