. 2019 Sep;7(9):1511-1522.
doi: 10.1158/2326-6066.CIR-18-0821. Epub 2019 Aug 5.

An RNA Aptamer-Based Biomarker Platform Demonstrates High Soluble CD25 Occupancy by IL2 in the Serum of Follicular Lymphoma Patients

Affiliations

An RNA Aptamer-Based Biomarker Platform Demonstrates High Soluble CD25 Occupancy by IL2 in the Serum of Follicular Lymphoma Patients

Suresh Veeramani et al. Cancer Immunol Res. 2019 Sep.

Abstract

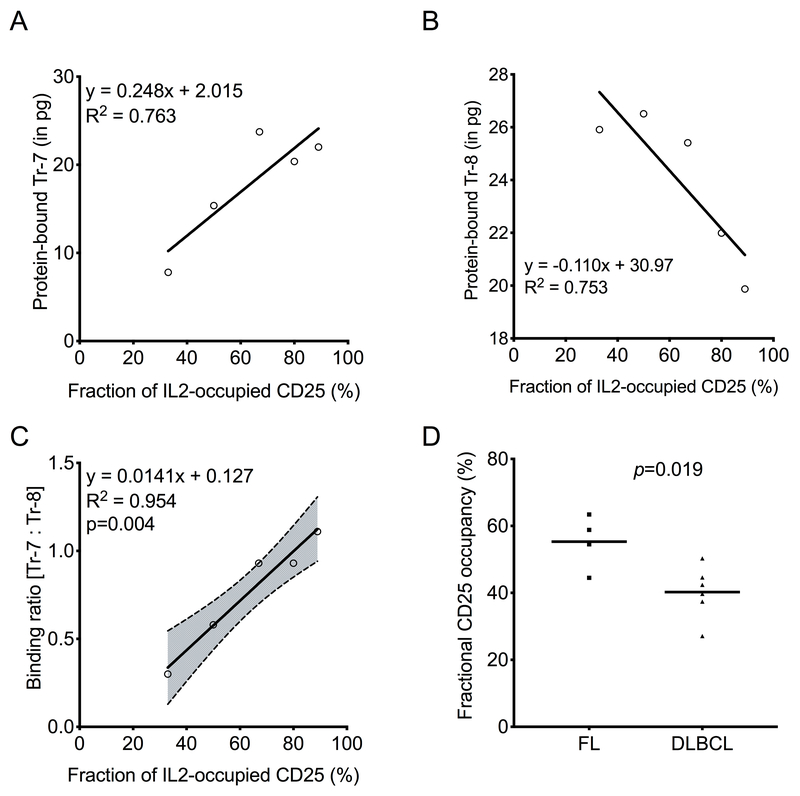
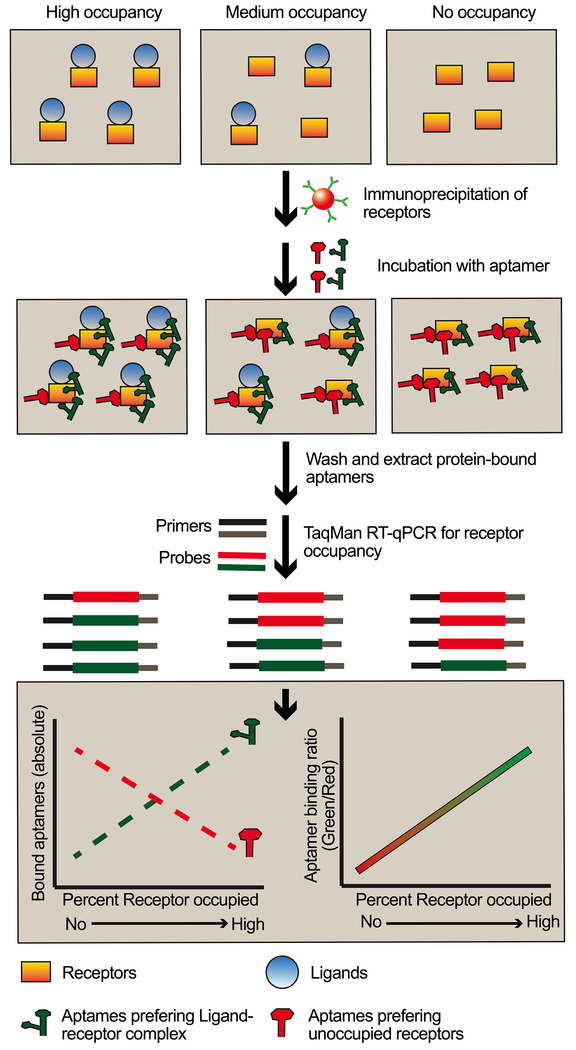
Ligand-receptor complexes play a central role in mediating a range of processes in immunology and cancer biology. The ability to directly quantify the fraction of receptors occupied by a ligand in a given biospecimen, as opposed to assessing the concentration of ligand and receptor separately, could provide an additional and valuable clinical and research tool for assessing whether receptors are occupied by a ligand. To address this need, a biomarker platform was developed to quantify the fraction of receptors occupied by a ligand using pairs of RNA aptamers, where one aptamer binds preferentially to the unoccupied receptor and the other to the ligand-receptor complex. Bound aptamer was quantified using RT-qPCR colorimetric probes specific for each aptamer. The binding ratio of aptamer correlated with the fraction of receptors occupied by a ligand. This assay, termed as LIRECAP (LIgand-REceptor Complex-binding APtamer) assay, was used to determine the fraction of soluble CD25 occupied by IL2 in the serum from subjects with B-cell lymphoma. No correlation was found between the type of lymphoma and total soluble CD25 or IL2 independently. In contrast, the fraction of soluble CD25 occupied by IL2 was significantly higher in follicular lymphoma patient serum compared with diffuse large B-cell lymphoma patient serum. We conclude that this technology has the potential to serve as a high-throughput biomarker platform to quantify the fraction of receptors occupied by a ligand.


Conflict of interest statement

Conflict of interests: The authors declare no potential conflict of interests.

Competing financial interests

The authors declare no competing financial interests.

Figures

Figure 1:
Figure 1:. Selection and identification of Treg-binding RNA aptamers.
(A) Treg-binding RNA aptamers were selected using a cell-based SELEX approach starting with a SEL2 generation-based library (with a 20-mer Random region). Each round of SELEX consisted of a negative selection step with CD4+CD25 Teff cells to preclear aptamers that bound to common T-cell antigens and a positive selection step with CD4+CD25high Tregs to select for Treg-binding aptamers. Treg-bound aptamers were extracted, amplified by RT-PCR, transcribed, and used for the next round of SELEX. A total of eight rounds of SELEX was done, with each round involving cells from a different normal donor. (B) Evaluation of binding to CD4+CD25 Teff cells and CD4+CD25high Tregs at the 3 rounds (Rd) indicated. A representative plot of two independent sets is shown (Mean±SEM). P values shown were calculated using the unpaired Student’s t-test. (C) High-throughput sequencing of enriched aptamers from each round of SELEX showing the number of unique sequences (per million total reads). (D) Percent of sequence enrichment during each round was calculated as 100 – [(Unique sequences/Total reads) * 100]. The data shows the linear enrichment of Treg-binding sequences from Rds 1 through 7.
Figure 2:
Figure 2:. Select Treg-specific aptamers recognize human CD25 and demonstrate differential binding to unoccupied CD25 vs. IL2-CD25 ligand-receptor complexes.
(A) The top enriched synthesized aptamers were evaluated for their ability to bind to CD4+CD25high Tregs ((IL2Rα+) and CD4+CD25 Teff cells (IL2Rα). Shown are representative data of two independent sets of experiments (Mean±SEM). (B) Binding of the twelve aptamers and C-248 control to recombinant human CD25. ((Mean±SEM); N=2). (C) An ELISA-based assay demonstrating the EC50 of the IL2-CD25 interaction (N=3). A representative plot from three independent sets of experiments is shown. (D) Flow cytometry of the phosphorylation of STAT5 (median fluorescent intensity) in human Tregs induced by IL2 and the influence of CD25 aptamers. A representative plot of three independent sets is shown. (E) Binding of aptamers to unoccupied CD25 and IL2-CD25 ligand-receptor complexes using CD25-coated beads incubated with and without IL2 (Mean±SEM; N=3). (F) Binding of aptamers to Tregs incubated with and without the addition of IL2. (Mean±SEM; N=2). All P values shown were calculated using the unpaired Student’s t-test.
Figure 3:
Figure 3:. Binding of aptamers correlates with IL2 occupancy of CD25.
Aptamer binding to His-tagged CD25-coated Dynabeads to determine (A) Tr-1, (B) Tr-7, and (C) Tr-8 binding to CD25 as its IL2 occupancy increases. This demonstrates binding to the IL2-CD25 complex (A-B) and to unoccupied CD25 (C). (D) The ration of Tr-1 to Tr-8 binding and (E) the ratio of Tr-7 to Tr-8 binding and their correlation with IL2 occupancy of CD25. A representative linear regression plot from four independent sets of experiment is shown. (A-C) Equation of the line, R2, and p values (where applicable) are shown. (D-E) Equation of the linear regression line (solid line), 95% confidence interval (dotted line with shaded area), and R2 are shown. P values for the slope of the regression line is shown.
Figure 4:
Figure 4:. Complex-induced immunosuppressive activity in CD4+ T cells correlates with IL2 occupancy of CD25.
The biological effect of IL2-CD25 complex with varying occupancies was determined. Variable fractional occupancy of CD25 by IL2 (0% to 89% was created by mixing Dynabeads coated with recombinant His-tagged CD25 and various concentrations of IL2 (160 nM to 0 nM). Beads containing various concentrations of unoccupied and IL2-occupied CD25 were added to freshly isolated primary human CD4+ T cells. (A) Flow cytometry showing the percentage of CD4+ T cells’ STAT5 phosphorylation in response to IL2-CD25 complexes compared to un-complexed CD25. A representative histogram of two independent experiments is shown. (B) Flow cytometry plots of Foxp3+ cells (Tregs) induced with increasing IL2 occupancy of CD25. A representative dot blot from two independent experiments is shown. Percentage of CD4+ T cells expressing FoxP3 is indicated. (C) ELISA of IL10 production in conditioned media with increasing IL2 occupancy of CD25. Mean±SEM of two independent experiments is shown. (D) Flow cytometry plot of CD8+ T-cell proliferation, as determined by CFSE, with increasing IL2 occupancy of CD25, measured by analyzing the ability of induced Tregs to inhibit the proliferation of cocultured CD8+ T cells. A representative histogram of two independent experiments is shown. All P values shown were calculated using the unpaired Student’s t-test.
Figure 5:
Figure 5:. Soluble CD25 occupancy by IL2 is greater in serum from subjects with FL than with DLBCL.
LIRECAP assay was performed on serum samples from lymphoma subjects (FL n=4; DLBCL n=6). A standard curve was produced by adding soluble CD25 and various concentrations of IL2 to normal human serum. Fractional occupancy of CD25 waswas analyzed using LIRECAP assay, as described in the Methods section. Correlation between the fractional occupancy of standards and aptamer binding was determined by linear regression. (A) Correlation of Tr-7, and (B) Tr-8 binding as IL2 occupancy of soluble CD25 increased. (C) The ratio of Tr-7 to Tr-8 binding and correlation with IL2 occupancy of soluble CD25. Equation of the linear regression line (solid line), 95% confidence interval (dotted line with shaded area) and R2 are shown. P values for the slope of the regression line is shown. (D) Comparison of IL2 occupancy of soluble CD25 in FL and DLBCL patient serum. P values shown were calculated using the unpaired Student’s t-test.
Figure 6:
Figure 6:. Schema demonstrating use of LIRECAP assay to estimate fraction of receptors occupied by ligand.
Differential binding of aptamers to unoccupied versus ligand-occupied receptor can be used to determine the fraction of receptor occupancy in biospecimens. After preparation of cells or immunoprecipitation of soluble receptors, aptamer pairs consisting of equimolar mix of aptamers preferring the complex and aptamers preferring the unoccupied receptors are incubated with samples with unknown levels of receptor occupancy. Aptamers preferring the complex bind to a greater degree in samples with higher receptor occupancy by ligand. Aptamers preferring the unoccupied receptors bind to a greater degree in samples with lower receptor occupancy by ligand. Aptamer levels are then quantified by probe-based RT-qPCR. The ratio of binding of aptamers to each sample is determined and compared to a standard curve to determine the percent of receptors occupied by ligand in the sample.

Similar articles

Cited by

References

    1. Waldmann TA. The biology of interleukin-2 and interleukin-15: implications for cancer therapy and vaccine design. Nat Rev Immunol 2006;6(8):595–601 doi 10.1038/nri1901. - DOI - PubMed
    1. Ito M, Zhao N, Zeng Z, Zhou X, Chang CC, Zu Y. Interleukin-2 Functions in Anaplastic Large Cell Lymphoma Cells through Augmentation of Extracellular Signal-Regulated Kinases ½ Activation. Int J Biomed Sci 2011;7(3):181–90. - PMC - PubMed
    1. Malek TR, Castro I. Interleukin-2 receptor signaling: at the interface between tolerance and immunity. Immunity 2010;33(2):153–65 doi 10.1016/j.immuni.2010.08.004. - DOI - PMC - PubMed
    1. Peggs KS, Quezada SA, Chambers CA, Korman AJ, Allison JP. Blockade of CTLA-4 on both effector and regulatory T cell compartments contributes to the antitumor activity of anti-CTLA-4 antibodies. J Exp Med 2009;206(8):1717–25 doi 10.1084/jem.20082492. - DOI - PMC - PubMed
    1. Whiteside TL, Schuler P, Schilling B. Induced and natural regulatory T cells in human cancer. Expert Opin Biol Ther 2012;12(10):1383–97 doi 10.1517/14712598.2012.707184. - DOI - PMC - PubMed

Publication types