Sulfadiazine Sodium Ameliorates the Metabolomic Perturbation in Mice Infected with Toxoplasma gondii
- PMID: 31383652
- PMCID: PMC6761496
- DOI: 10.1128/AAC.00312-19
Sulfadiazine Sodium Ameliorates the Metabolomic Perturbation in Mice Infected with Toxoplasma gondii
Abstract
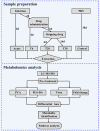
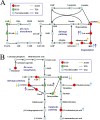
In this study, we analyzed the global metabolomic changes associated with Toxoplasma gondii infection in mice in the presence or absence of sulfadiazine sodium (SDZ) treatment. BALB/c mice were infected with T. gondii GT1 strain and treated orally with SDZ (250 μg/ml in water) for 12 consecutive days. Mice showed typical manifestations of illness at 20 days postinfection (dpi); by 30 dpi, 20% had survived and developed latent infection. We used ultraperformance liquid chromatography-mass spectrometry to profile the serum metabolomes in control (untreated and uninfected) mice, acutely infected mice, and SDZ-treated and infected mice. Infection induced significant perturbations in the metabolism of α-linolenic acid, purine, pyrimidine, arginine, tryptophan, valine, glycerophospholipids, and fatty acyls. However, treatment with SDZ seemed to alleviate the serum metabolic alterations caused by infection. The restoration of the serum metabolite levels in the treated mice was associated with better clinical outcomes. These data indicate that untargeted metabolomics can reveal biochemical pathways associated with restoration of the metabolic status of T. gondii-infected mice following SDZ treatment and could be used to monitor responses to SDZ treatment. This study provides a new systems approach to elucidate the metabolic and therapeutic effects of SDZ in the context of murine toxoplasmosis.
Keywords: Toxoplasma gondii; biomarkers; metabolomics; mice; serum metabolites; sulfadiazine sodium.
Copyright © 2019 American Society for Microbiology.
Figures


Similar articles
-
Efficacy of sulfadiazine and pyrimetamine for treatment of experimental toxoplasmosis with strains obtained from human cases of congenital disease in Brazil.Exp Parasitol. 2019 Jul;202:7-14. doi: 10.1016/j.exppara.2019.05.001. Epub 2019 May 8. Exp Parasitol. 2019. PMID: 31077733
-
Genetic Polymorphisms and Phenotypic Profiles of Sulfadiazine-Resistant and Sensitive Toxoplasma gondii Isolates Obtained from Newborns with Congenital Toxoplasmosis in Minas Gerais, Brazil.PLoS One. 2017 Jan 24;12(1):e0170689. doi: 10.1371/journal.pone.0170689. eCollection 2017. PLoS One. 2017. PMID: 28118394 Free PMC article.
-
The timing of sulfadiazine therapy impacts the reactivation of latent Toxoplasma infection in IRF-8-/- mice.Parasitol Res. 2007 Nov;101(6):1603-9. doi: 10.1007/s00436-007-0700-y. Epub 2007 Sep 12. Parasitol Res. 2007. PMID: 17846793
-
In vitro and in vivo activities of the hydroxynaphthoquinone atovaquone alone or combined with pyrimethamine, sulfadiazine, clarithromycin, or minocycline against Toxoplasma gondii.Antimicrob Agents Chemother. 1993 Nov;37(11):2371-8. doi: 10.1128/AAC.37.11.2371. Antimicrob Agents Chemother. 1993. PMID: 8285620 Free PMC article.
-
Drug Resistance in Toxoplasma gondii.Front Microbiol. 2018 Oct 29;9:2587. doi: 10.3389/fmicb.2018.02587. eCollection 2018. Front Microbiol. 2018. PMID: 30420849 Free PMC article. Review.
Cited by
-
Pre-existing Toxoplasma gondii infection increases susceptibility to pentylenetetrazol-induced seizures independent of traumatic brain injury in mice.Front Mol Neurosci. 2023 Jan 5;15:1079097. doi: 10.3389/fnmol.2022.1079097. eCollection 2022. Front Mol Neurosci. 2023. PMID: 36683847 Free PMC article.
-
UPLC-MS-Based Serum Metabolomics Reveals Potential Biomarkers of Ang II-Induced Hypertension in Mice.Front Cardiovasc Med. 2021 May 5;8:683859. doi: 10.3389/fcvm.2021.683859. eCollection 2021. Front Cardiovasc Med. 2021. PMID: 34026879 Free PMC article.
-
A pre-existing Toxoplasma gondii infection exacerbates the pathophysiological response and extent of brain damage after traumatic brain injury in mice.J Neuroinflammation. 2024 Jan 9;21(1):14. doi: 10.1186/s12974-024-03014-w. J Neuroinflammation. 2024. PMID: 38195485 Free PMC article.
-
Transcriptional changes in Toxoplasma gondii in response to treatment with monensin.Parasit Vectors. 2020 Feb 18;13(1):84. doi: 10.1186/s13071-020-3970-1. Parasit Vectors. 2020. PMID: 32070423 Free PMC article.
-
Ultra Performance Liquid Chromatography-Tandem Mass Spectrometry-Based Metabolomics Reveals Metabolic Alterations in the Mouse Cerebellum During Toxoplasma gondii Infection.Front Microbiol. 2020 Jul 10;11:1555. doi: 10.3389/fmicb.2020.01555. eCollection 2020. Front Microbiol. 2020. PMID: 32765450 Free PMC article.
References
-
- Taylor S, Barragan A, Su C, Fux B, Fentress SJ, Tang K, Beatty WL, Hajj HE, Jerome M, Behnke MS, White M, Wootton JC, Sibley LD. 2006. A secreted serine-threonine kinase determines virulence in the eukaryotic pathogen Toxoplasma gondii. Science 314:1776–1780. doi:10.1126/science.1133643. - DOI - PubMed
Publication types
MeSH terms
Substances
LinkOut - more resources
Full Text Sources

