. 2019 Aug 5;10(1):3512.
doi: 10.1038/s41467-019-11461-w.

Quantifying the impact of public omics data

Affiliations

Quantifying the impact of public omics data

Yasset Perez-Riverol et al. Nat Commun. .

Abstract

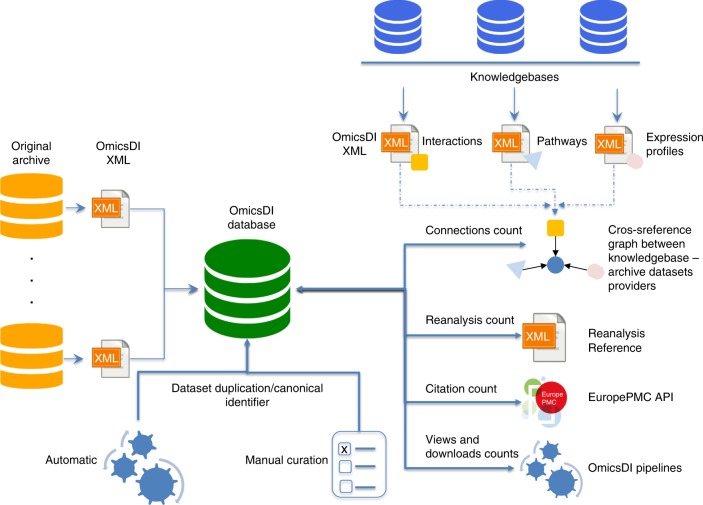
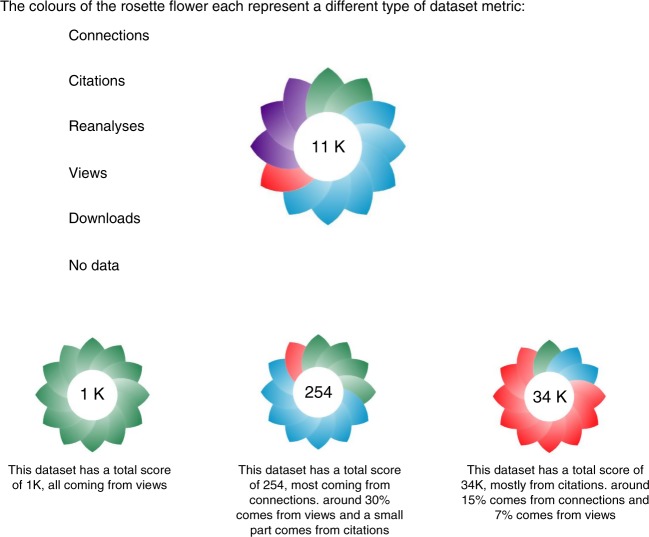
The amount of omics data in the public domain is increasing every year. Modern science has become a data-intensive discipline. Innovative solutions for data management, data sharing, and for discovering novel datasets are therefore increasingly required. In 2016, we released the first version of the Omics Discovery Index (OmicsDI) as a light-weight system to aggregate datasets across multiple public omics data resources. OmicsDI aggregates genomics, transcriptomics, proteomics, metabolomics and multiomics datasets, as well as computational models of biological processes. Here, we propose a set of novel metrics to quantify the attention and impact of biomedical datasets. A complete framework (now integrated into OmicsDI) has been implemented in order to provide and evaluate those metrics. Finally, we propose a set of recommendations for authors, journals and data resources to promote an optimal quantification of the impact of datasets.


Conflict of interest statement

The authors declare no competing interests.

Figures

Fig. 1
Fig. 1
Examples of the reanalysis network for different OmicsDI datasets: a BioModels model BIOMD0000000055. BioModels are reused over time (e.g. 2006–2015) to build new models; in the BioModel database each new model contains references to the original source model of information. b Twelve different BioModels models are connected through a reanalysis network. The BioModel database traces the origin of each model and the relations between them, enabling to trace complex reanalysis relations where models can be originated from multiple models and be used by other models. c Proteomics reanalysis network for the draft of the human proteome project (PRIDE accession PXD000561). In proteomics, the predominant reanalysis pattern is “one to many”, where original deposited submissions are reanalysed in multiple datasets by multiple authors
Fig. 2
Fig. 2
a Elapsed time between the original publication of a dataset and the publication of all its reanalyses for three omics data archives (PRIDE—Proteomics, GEO—Transcriptomics, ArrayExpress—Transcriptomics). Transcriptomics datasets tend to be reanalysed over time until datasets are 12 years old, while proteomics datasets (PRIDE) are less reused after 3 years from their publication. b Distribution of the number of citations per dataset group by OmicsDI omics type. Transcriptomics datasets are highly cited with more than 30,000 datasets with 11 citations; while in genomics, proteomics and metabolomics most datasets are only cited once
Fig. 3
Fig. 3
Correlation between the OmicsDI metrics (reanalyses, citations, downloads and connections) and omics type (proteomics, genomics, transcriptomics, metabolomics and multiomics). The lower left panels show the scatter plots of each combination and the upper right panels shows the values for each type of omics. For example, the number of downloads and the number of connections of Genomics datasets (red) is highly correlated (R = 0.5) compared to all other metrics combinations
Fig. 4
Fig. 4
Average distribution of each metric (citations, views, reanalysis, downloads and connections) by omics type: raw (a, c, e, g, i) and normalised values (b, d, f, h, j). The raw values are the metrics values collected with the OmicsDI pipelines, whereas the normalised values are the transformation of those values using MinMax scaler or the Biological connections normalisation method
Fig. 5
Fig. 5
The metrics estimation pipeline is based on the OmicsDI XML file format that is used to transfer datasets from each provider into OmicsDI. Data is imported from each provider into a central MongoDB database. An automatic pipeline is run to detect duplication and data replication across the resource. The pipelines use the central MongoDB database, the EuropePMC API and the knowledgebases (e.g. Ensembl, UniProt) to compute/estimate the different metrics
Fig. 6
Fig. 6
The OmicsDI badge (Rosette flower) represents all the OmicsDI metrics. In the centre of the badge the OmicsDI score estimates the global impact using all metrics

References

    1. Perez-Riverol Y, et al. Discovering and linking public omics data sets using the Omics Discovery Index. Nat. Biotechnol. 2017;35:406–409. doi: 10.1038/nbt.3790. - DOI - PMC - PubMed
    1. Ohno-Machado L, et al. Finding useful data across multiple biomedical data repositories using DataMed. Nat. Genet. 2017;49:816–819. doi: 10.1038/ng.3864. - DOI - PMC - PubMed
    1. Perez-Riverol Y, Alpi E, Wang R, Hermjakob H, Vizcaino JA. Making proteomics data accessible and reusable: current state of proteomics databases and repositories. Proteomics. 2015;15:930–949. doi: 10.1002/pmic.201400302. - DOI - PMC - PubMed
    1. Rung J, Brazma A. Reuse of public genome-wide gene expression data. Nat. Rev. Genet. 2013;14:89–99. doi: 10.1038/nrg3394. - DOI - PubMed
    1. Wilkinson MD, et al. The FAIR Guiding Principles for scientific data management and stewardship. Sci. Data. 2016;3:160018. doi: 10.1038/sdata.2016.18. - DOI - PMC - PubMed

Publication types

MeSH terms