. 2019 Aug 5;9(1):11333.
doi: 10.1038/s41598-019-47719-y.

Characterization of subcutaneous and omental adipose tissue in patients with obesity and with different degrees of glucose impairment

Affiliations

Characterization of subcutaneous and omental adipose tissue in patients with obesity and with different degrees of glucose impairment

Anna Belligoli et al. Sci Rep. .

Abstract

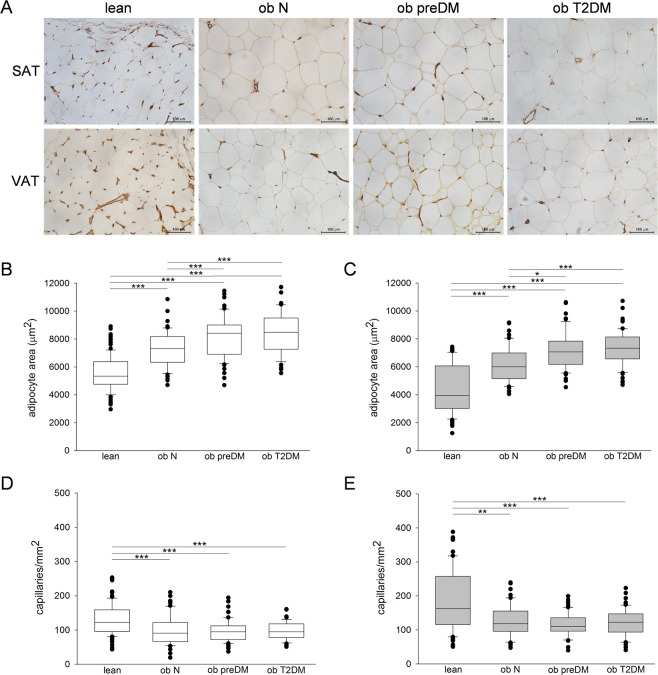
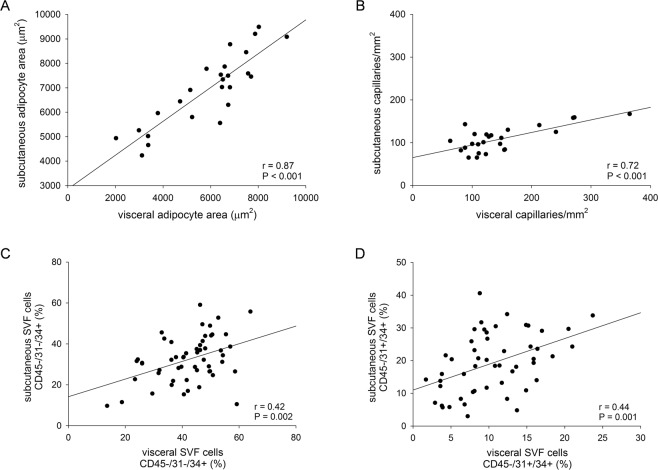
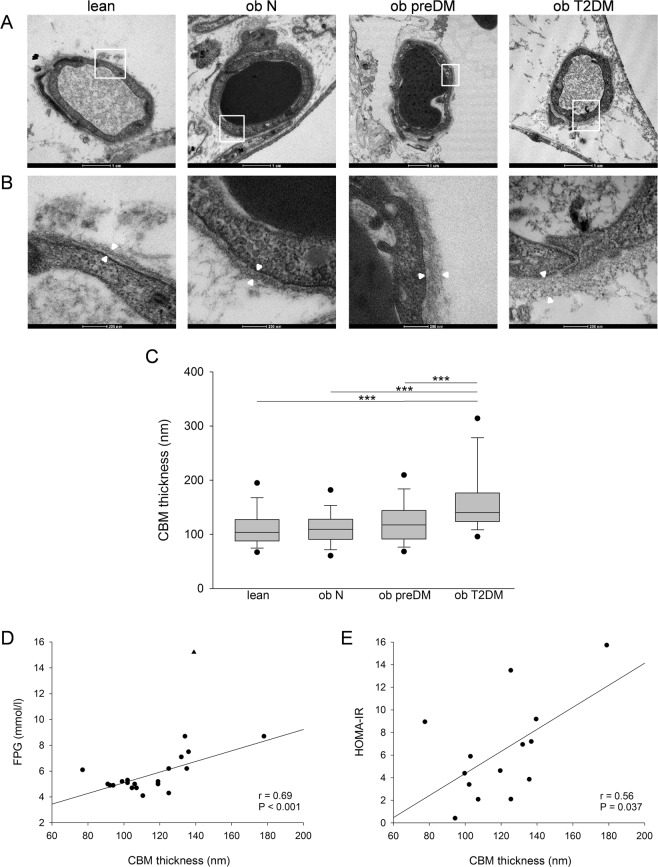
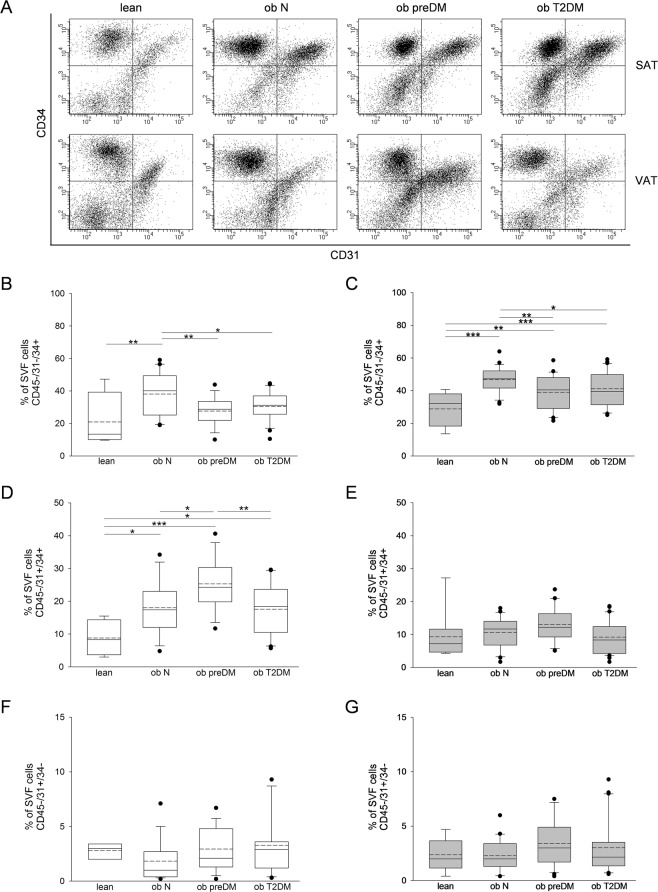
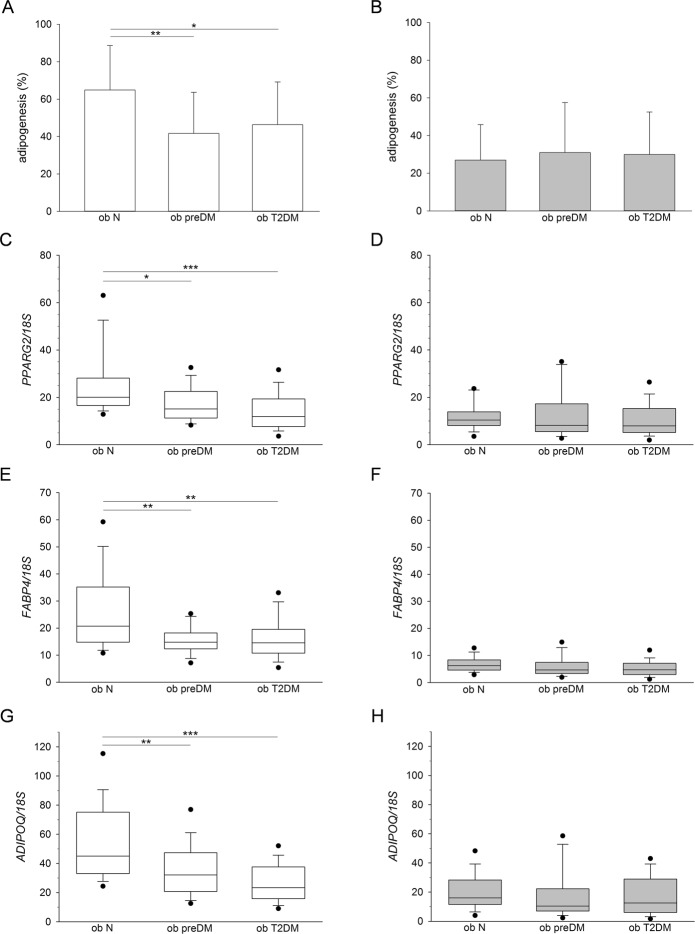
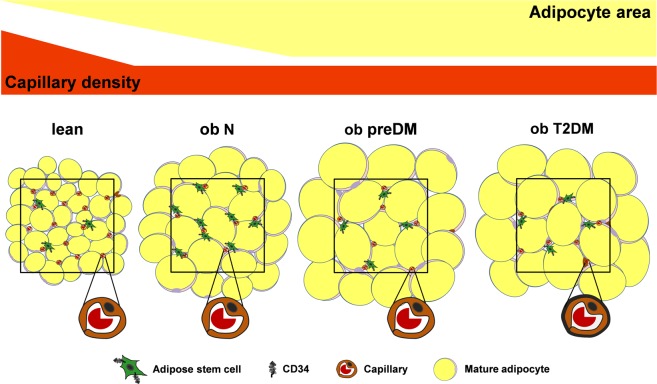
Although obesity represents a risk factor for the development of type 2 diabetes mellitus (T2DM), the link between these pathological conditions is not so clear. The manner in which the different elements of adipose tissue (AT) interplay in order to grow has been suggested to have a role in the genesis of metabolic complications, but this has not yet been fully addressed in humans. Through IHC, transmission electron microscopy, cytometry, and in vitro cultures, we described the morphological and functional changes of subcutaneous and visceral AT (SAT and VAT) in normoglycemic, prediabetic and T2DM patients with obesity compared to lean subjects. In both SAT and VAT we measured a hypertrophic and hyperplastic expansion, causing similar vascular rarefaction in obese patients with different degrees of metabolic complications. Capillaries display dysfunctional basement membrane thickening only in T2DM patients evidencing VAT as a new target of T2DM microangiopathy. The largest increase in adipocyte size and decrease in adipose stem cell number and adipogenic potential occur both in T2DM and in prediabetes. We showed that SAT and VAT remodeling with stemness deficit is associated with early glucose metabolism impairment suggesting the benefit of an AT-target therapy controlling hypertrophy and hyperplasia already in prediabetic obese patients.


Conflict of interest statement

The authors declare no competing interests.

Figures

Figure 1
Figure 1
Immunohistochemistry for CD31, adipocyte size and capillary density analysis in human SAT and VAT. Representative photomicrographs of SAT and VAT sections from the 4 groups of patients studied: lean control subjects, normoglycemic (ob N), prediabetic (ob preDM) and diabetic (ob T2DM) obese patients stained with anti-CD31 antibody (A). Measurements of adipocyte area (µm2) and quantification of capillary density (number of capillaries per mm2) in the SAT (white boxes, B,D) and VAT (grey boxes, C,E) of 10 lean, 5 ob N, 5 ob preDM and 5 ob T2DM patients. The results are displayed as box plot graphs: the box represents the lower and upper quartiles, the line in the box represents the median, the whiskers show the lowest and highest values and the outliers indicating the median value of measurements for one field are represented by black circles. Data was analyzed using One Way ANOVA (Fisher LSD method) in (B) and Kruskal-Wallis test (Dunn’s method) in (CE), *P ≤ 0.05, **P ≤ 0.01, ***P ≤ 0.001.
Figure 2
Figure 2
The correlation between data obtained from AT depots. The quantifications of adipocyte area (A), capillary density (B), adipose stem cells CD45−/31−/34+ (C) and endothelial progenitors CD45−/31+/34+ (D) in SAT and VAT depots were correlated using Pearson’s coefficient. Number of the patients analyzed was 25 in (A,B), 54 in (C) and 51 in (D).
Figure 3
Figure 3
Capillary morphology, CBM thickness and correlation analysis in human VAT. Representative transmission electron micrographs of transverse sections of VAT capillaries in the lean control subjects and in the normoglycemic (ob N), prediabetic (ob preDM) and diabetic (ob T2DM) obese patients (A). Regions in the white boxes in (A) are shown at higher magnification in (B). White arrowheads indicate the CBM thickness, which was measured at multiple points in each micrograph. CBM thickness (nm) in the VAT was analyzed in 6 lean, 5 ob N, 5 ob preDM and 5 ob T2DM subjects (C). Data are reported as box plot graph with the lowest and highest values (whiskers), the medians (lines) and the 5th and 95th percentiles (black circles outside the whiskers). Correlation analysis was performed between CBM thickness, FPG of all patients with the exclusion of one outlier indicated by a triangle, and HOMAIR of 14 obese patients (D,E). Data was analyzed using the Kruskal-Wallis test (Dunn’s method) in (C), ***P ≤ 0.001, and Pearson’s correlation coefficient in (D,E).
Figure 4
Figure 4
Flow cytometric analysis of SVF cells obtained from human SAT and VAT. Representative flow cytometric dot plots of surface markers CD34 vs CD31 determining the percentage of adipose stem cells (ASCs) (CD45−/31−/34+), endothelial progenitor cells (CD45/31+/34+) and endothelial mature cells (CD45−/31+/34−) within SVF freshly isolated from SAT and VAT of the lean control subjects and normoglycemic (ob N), prediabetic (ob preDM) and diabetic (ob T2DM) obese patients (A). Quantification of ASCs (B,C), endothelial progenitor (D,E) and endothelial mature cells (F,G) contained in SVF from SAT (white boxes, B,D,F) and VAT (grey boxes, C,E,G). The percentage of cells were displayed as box plot graphs with the lowest and highest values (whiskers), the medians (lines), the means (dashed lines) and the outliers (black circles). The number of AT samples analyzed for each group was: 4 lean, 20 ob N, 15 ob preDM, 23 ob T2DM in SAT and 9 lean, 23 ob N, 21 ob preDM, 30 ob T2DM in VAT. The data was analyzed using the One Way ANOVA test followed, when statistically significant, by Fisher LSD test in (BD) and Kruskal-Wallis test (Dunn’s method) in (EG), *P ≤ 0.05, **P ≤ 0.01, ***P ≤ 0.001.
Figure 5
Figure 5
In vitro adipogenic potential of SVF cells obtained from human SAT and VAT. The percentage of mature adipocytes was obtained by optical microscope analysis, upon Oil-Red O staining, of in vitro adipogenic differentiated cell cultures isolated from SAT (white columns) and VAT (grey columns) of normoglycemic (ob N), prediabetic (ob preDM) and diabetic (ob T2DM) obese patients (A,B). The data, described as mean value ± SD, was analyzed using the One Way ANOVA test followed, when statistically significant, by Fisher LSD test in (A) and Kruskal-Wallis test (Dunn’s method) in (B), *P ≤ 0.05, **P ≤ 0.01. The patients analyzed were: 18 ob N, 15 ob preDM, 13 ob T2DM in SAT and 20 ob N, 25 ob preDM, 23 ob T2DM in VAT. PPARG2 (C,D), FABP4 (E,F), ADIPOQ (G,H) mRNA levels quantified in adipogenic differentiated cell cultures obtained from SAT (white boxes, C,E,G) and VAT (grey boxes, D,F,H) of ob N, ob preDM and ob T2DM patients, normalized to 18S rRNA content, are reported as box plot graph with the lowest and highest values (wiskers), the medians (lines) and 5th and 95th percentiles (black circles outside the whiskers). Statistical analysis was performed using Kruskal-Wallis test followed by Dunn’s multiple comparison post-hoc test in (CH), *P ≤ 0.05, **P ≤ 0.01, ***P ≤ 0.001. The patients analyzed were: 17 ob N, 15 ob preDM, 12 ob T2DM in SAT and 20 ob N, 25 ob preDM, 23 ob T2DM in VAT.
Figure 6
Figure 6
Adipose tissue remodeling in obesity and metabolic complications. During obesity AT grows both by hypertrophy and hyperplasia determining vascular rarefaction. Enhanced enlargement of mature adipocytes and a significant decrease in ASCs occur early in the prediabetic condition and these modifications are also present into overt diabetes, suggesting further expansion mainly by hypertrophy. AT capillaries display marked CBM thickening (black line) only in overt diabetes (AT microangiopathy), suggesting vascular dysfunction and further perfusion reduction. The black squares circumscribe 1 mm2. ob N = patients with obesity and normoglycemia; ob preDM = patients with obesity and prediabetes; ob T2DM = patients with obesity and diabetes.

References

    1. Kahn SE, Cooper ME, Del Prato S. Pathophysiology and treatment of type 2 diabetes: perspectives on the past, present, and future. Lancet. 2014;383(9922):1068–83. doi: 10.1016/S0140-6736(13)62154-6. - DOI - PMC - PubMed
    1. Levy BI, et al. Impaired tissue perfusion: a pathology common to hypertension, obesity, and diabetes mellitus. Circulation. 2008;118(9):968–76. doi: 10.1161/CIRCULATIONAHA.107.763730. - DOI - PubMed
    1. Pasarica M, et al. Reduced adipose tissue oxygenation in human obesity: evidence for rarefaction, macrophage chemotaxis, and inflammation without an angiogenic response. Diabetes. 2009;58(3):718–725. doi: 10.2337/db08-1098. - DOI - PMC - PubMed
    1. Gealekman O, et al. Depot-specific differences and insufficient subcutaneous adipose tissue angiogenesis in human obesity. Circulation. 2011;123(2):186–94. doi: 10.1161/CIRCULATIONAHA.110.970145. - DOI - PMC - PubMed
    1. Sung HK, et al. Adipose Vascular Endothelial Growth Factor Regulates Metabolic Homeostasis through Angiogenesis. Cell Metab. 2013;17(1):61–72. doi: 10.1016/j.cmet.2012.12.010. - DOI - PubMed

Publication types