. 2019 Aug 5;9(1):11324.
doi: 10.1038/s41598-019-47815-z.

Structure functional insights into calcium binding during the activation of coagulation factor XIII A

Affiliations

Structure functional insights into calcium binding during the activation of coagulation factor XIII A

Sneha Singh et al. Sci Rep. .

Abstract

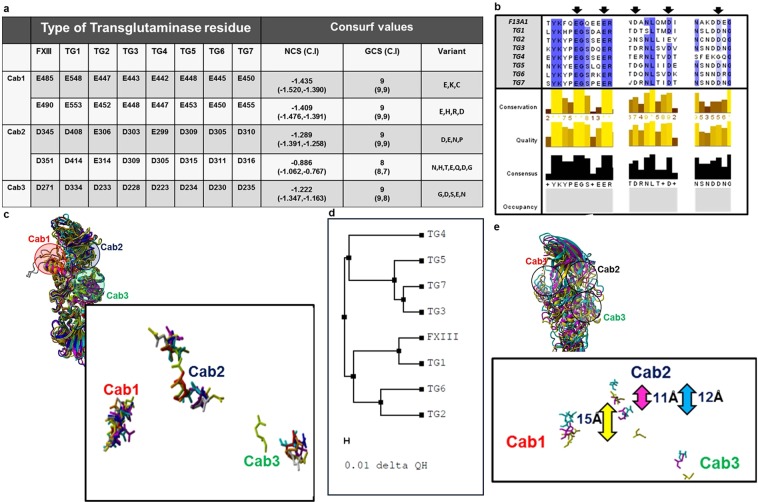
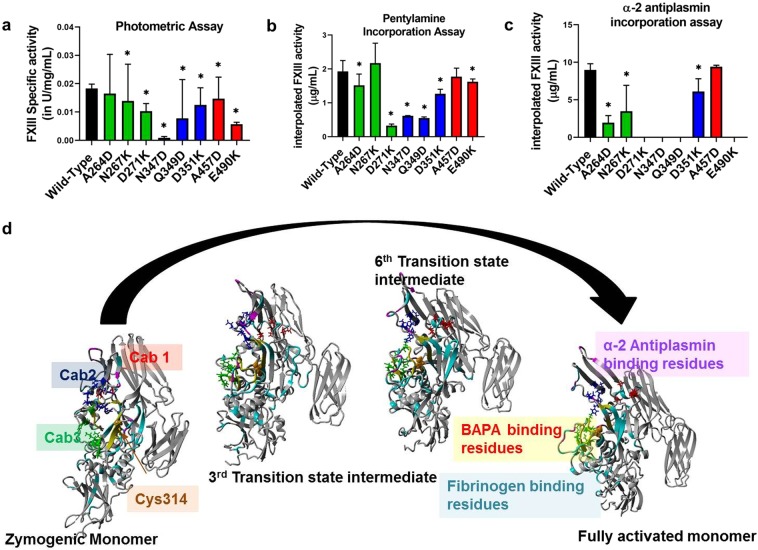
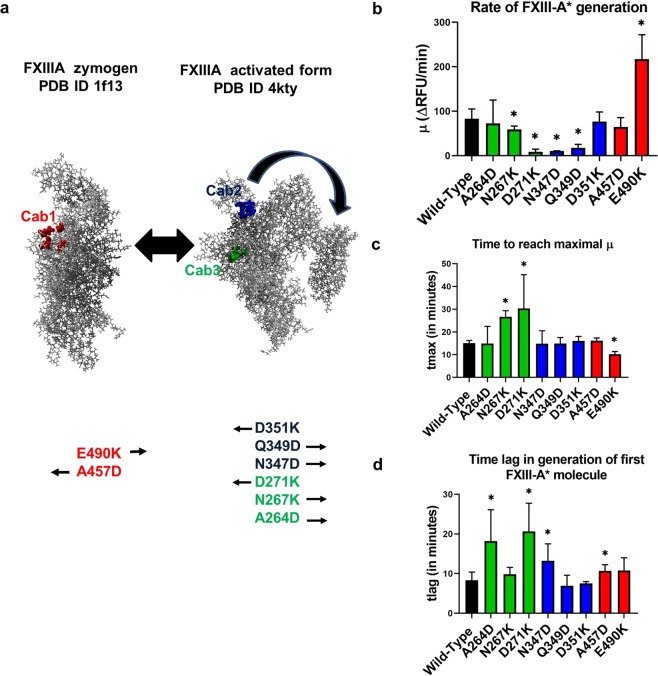
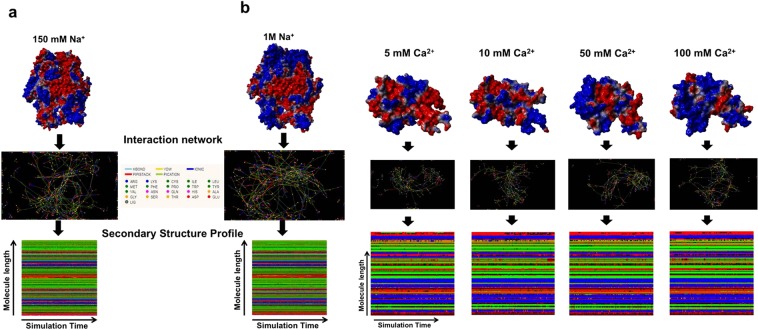
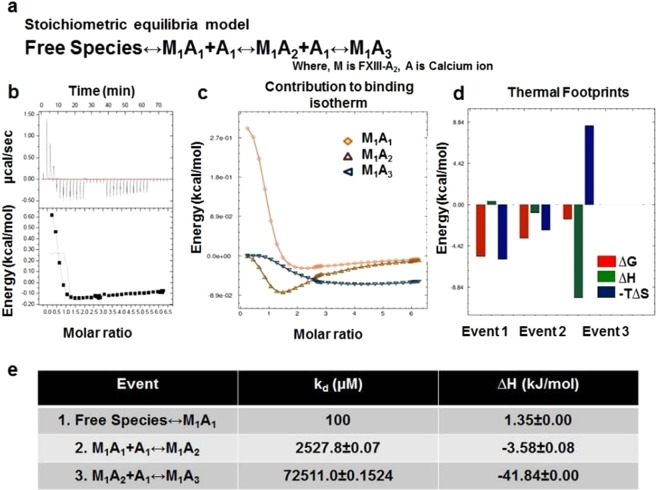
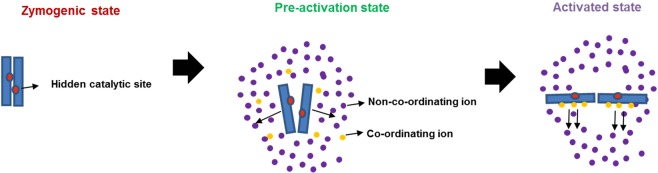
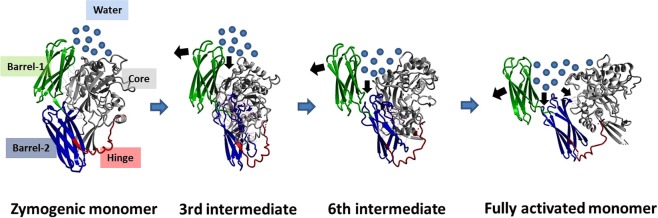
The dimeric FXIII-A2, a pro-transglutaminase is the catalytic part of the heterotetrameric coagulation FXIII-A2B2 complex that upon activation by calcium binding/thrombin cleavage covalently cross-links preformed fibrin clots protecting them from premature fibrinolysis. Our study characterizes the recently disclosed three calcium binding sites of FXIII-A concerning evolution, mutual crosstalk, thermodynamic activation profile, substrate binding, and interaction with other similarly charged ions. We demonstrate unique structural aspects within FXIII-A calcium binding sites that give rise to functional differences making FXIII unique from other transglutaminases. The first calcium binding site showed an antagonistic relationship towards the other two. The thermodynamic profile of calcium/thrombin-induced FXIII-A activation explains the role of bulk solvent in transitioning its zymogenic dimeric form to an activated monomeric form. We also explain the indirect effect of solvent ion concentration on FXIII-A activation. Our study suggests FXIII-A calcium binding sites could be putative pharmacologically targetable regions.


Conflict of interest statement

The authors declare no competing interests.

Figures

Figure 1
Figure 1
Conservation of calcium binding sites in Transglutaminases with respect to FXIII-A. Panel a tabulates the conservation results generated for the FXIII-A amino acid sequence input (Uniprot ID: P00488; F13A_HUMAN) on the Consurf server. Abbreviations: NCS: Normalized conservation score, GCS: Generalized conservation score. Panel b illustrates the actual alignment generated as output on the Consurf server for the FXIII-A subunit sequence input. The highly conserved residues are shaded in blue. Arrows indicate the binding site residues mutated in this study. Panel c shows a structural alignment of all seven human Transglutaminases i.e. of three crystal structures TG2, TG3 and FXIII-A and threaded models for the remaining four transglutaminases. The structures are depicted in ribbon format. The inset image shows the spatial alignment of the calcium binding site residues of all transglutaminases as stick models. The different transglutaminases are colored differently. Panel d shows a structural similarity tree generated from the structural alignment on Panel c. The distances on the tree represented by the delta QH value is proportional to the dissimilarity between two structures i.e. the farther two structures are there on the tree, the more structurally unlike they are. Panel e shows the structural alignment of only three human Transglutaminases with biophysical crystal structures i.e. TG2, TG3 and FXIII-A. The inset diagram the spatial alignment of the calcium binding site residues as stick models of the three human transglutaminases. The structures are depicted in ribbon format with TG2, TG3 and FXIII colored yellow, magenta and cyan respectively. The bidirectional arrows represent the C-α backbone atom distances between the D345 and D351 residue (FXIII; cyan), E306 and E314 residue (TG2; yellow), and D303 and D309 residue (TG3; magenta).
Figure 2
Figure 2
Effect of rFXIII-A calcium binding site mutants on its specific activity and substrate specificity. Panels a, b and c represent comparative bar graphs for Specific activity of intracellular lysates (wild type and variant) based on Photometric assay, interpolated FXIII-A activity based on Pentylamine incorporation assay and α-2 antiplasmin incorporation assay, respectively. In the event a variant is significantly different than the wild type, it is marked with a star (*) sign on top of the corresponding bar. Statistical significance is set at p < 0.05. Experiments were performed in duplicates, thrice (N = 6). Panel d shows the putative fibrinogen, α-2 antiplasmin and BAPA binding site residues on zymogenic FXIII-A monomeric and activated monomeric FXIII-A* structures along with two intermediate transition state structures. The structure backbone is depicted in grey colored ribbon format. The putative binding site region backbones are colored cyan for fibrinogen, yellow for BAPA and magenta for α-2 antiplasmin. The three calcium binding sites are also depicted on all four structures as stick models colored red (Cab1), blue (Cab2) and green (Cab3) respectively.
Figure 3
Figure 3
Results of FXIII-A* generation assay for rFXIII-A calcium binding site mutants. Panel a explains the principle underlying different rFXIII-A calcium binding site mutants generated in this study. It depicts the conformational transformation between the zymogenic and activated FXIII-A crystal structures. Both structures are depicted as grey ball and stick models. The first calcium binding site (Cab1) residues are depicted as red ball models on the zymogenic FXIII-A crystal structure because the coordination of this site is a zymogenic constraint. The second and third calcium binding site (Cab2 and Cab3) are depicted as blue and green ball models respectively on the activated FXIII-A* crystal structure. Below both these structures, the mutants generated for this study are listed with arrows indicating the anticipated structure favored by each of this mutant as per our hypothesis. Panels b, c and d depict the comparative bar graphs corresponding to three major parameters (μ, tmax and tlag) obtained from the FXIII-A* generation assay. In the event a variant is significantly different than the wild type, it is marked with a star (*) sign on top of the corresponding bar. Statistical significance is set at p < 0.05. Experiments were performed in in duplicates, thrice (N = 6). Please note, FXIII-A* generation data for the mutants D271K and N347D show very low activity and a fit of the data to the model revealed no valid estimates.
Figure 4
Figure 4
Effect of calcium and sodium on the structure of FXIII-A. Upper parts of panels a and b represent the simulation snapshots of full length FXIII-A molecule and FXIII-A core domain post 100 ns of simulation in different sodium and calcium concentrations respectively as indicated. The simulation snapshot structures are depicted by their molecular surface view with the electrostatic potential (Red: Negative, Blue: Positive) superimposed on it. Below the simulation snapshots in both panels are the Residue interaction network (RIN) or the inter-residue interaction chart extracted from the Ring 2.0 server by submitting to it the post 100 ns simulation snapshot as a PDB file under default server conditions. Lowermost section of both panels is the Secondary structure profile for the entire 100 ns of simulation plotted for the entire length of the molecule. The colour code for the secondary structure profile is the following: Coil: Red, Strand: Green, Helix: Blue, Turn: Black.
Figure 5
Figure 5
Calcium binding to rFXIII-A2 studied by ITC. Panel a. Equation depicting the stoichiometric binding equilibrium model, followed for the analysis of data derived from ITC (Model was generated in Affinimeter using model builder approach). Panel b. Titration of 1.25 mM rFXIII-A2, with 25 mM CaCl2 (c-value = 20). Upper image of this panel is the raw data depicting the heat change upon each injection; lower image in this panel is the normalized data, with integrated heat change plotted against the concentration ratio of calcium vs rFXIII-A2. Solid black line represents the corresponding fit obtained in Origin software using sequential binding mode, with n = 3. All heat changes are plotted after subtraction of reference titration (no rFXIII-A2 in sample cell vs. 25 mM CaCl2 in the presence of thrombin, at same conditions) Panels c, d and e are based on evaluation performed on Affinimeter (see Supplementary Fig. 5 for corresponding fit curves). Panel c depicts the contribution of individual species, generated during a sequential binding of calcium to FXIII-A (based on earlier observations and as participants of the Stoichiometric equilibria here (Panel A)), towards the binding isotherm. Panel d is the comparative heat signatures, or the thermal footprints obtained at each binding event following the equation ∆G = ∆H - T∆S (2nd Law of Thermodynamics); explaining the three thermodynamic events, and their corresponding changes in free energy (∆G), entropy (-T∆S) and enthalpy (∆H) (for the corresponding data obtained at c-value = 25,000 please refer to the Supplementary Fig. 6). Panel e is table representing event-wise changes in enthalpy (∆H), in kJ/mol, and corresponding change in binding affinity of calcium ions towards FXIII-A in all three corresponding events as per the stoichiometric equilibria model.
Figure 6
Figure 6
Effect of ancillary sodium ions towards generation of a pre-activation state of FXIII-A molecule. A cartoonist impression of the FXIII-A zymogenic state where no ions are influencing the structure followed by pre-activation state where the both the non-coordinating (assumed to be sodium in purple) as well as later coordinating ions (assumed to be calcium in yellow) influence the structure and conformation of FXIII-A molecule by altering its surface electrostatic properties. The last part of the figure depicts the fully activated molecule which is the final outcome of the coordination of the coordinating ions to its binding sites in a FXIII-A molecule that has already been moved from its zymogenic to a pre-activation state.
Figure 7
Figure 7
Entry of bulk solvent induces movement of β-barrel domains. Figure illustrates the stepwise conformational changes occurring during the activation of FXIII-A. The figure(s) represent in successive order the zymogenic crystal structure of FXIII-A monomer, the third and sixth transition state intermediate models reported earlier and the fully activated structure of FXIII-A monomer. All structures are depicted in the ribbon format. The N-terminal beta sandwich domain has been hidden for the sake of clarity. The β-barrel 1 and β-barrel 2 domains are coloured in green and blue respectively while the core domain is coloured grey. The hinge region of almost 20 amino acids is coloured red. The water solvation shell is depicted with blue circles. The movement of the β-barrel domains is depicted with black arrows. Contacts between the core and β-barrel domains are depicted with lightly coloured lines.
Figure 8
Figure 8
Derived Thermo-chemical Activation Cycle of Coagulation FXIII-A molecule in plasma. The free FXIII-A2 dimer, when devoid of any calcium possesses intact FXIII-AP and this species represents a low free energy stable form. Cleavage of FXIII-AP by thrombin is followed by coordination and subsequent saturation of Cab1 and Cab2. Cab1 being spatially more accessible gets saturated faster and strongly than Cab2 yielding a low-energy, relatively stable state. Subsequently, the Cab2 coordination transiently disrupts Cab1 giving rise to a high-energy, unstable, transient state (event 1). The increasing saturation of Cab2 accompanied by the conformational changes directed by it result in the stabilization of unstable intermediate bringing down free energy. Meanwhile, slow disruption of the dimeric interface proceeds as the molecule proceeds towards full saturation (Cab3 gets exposed with the dimeric interface coming apart) (event 2). As the dimer loosens up, water molecules seep through and expose the dimeric interface further. Sharp movements of β-barrel domains as a consequence of calcium saturation, and movement of water molecules across the dimeric interface raise the entropy of the system, that finally culminate into dimer disruption, giving rise to monomeric, energy minimized, open active FXIII-A* species (event 3). Blue-grey object depict the N & C terminal of FXIII-A monomer, respectively. Molecule solvation shell is represented by dotted circle. Calcium ion saturation at Cab1, Cab2 and Cab3 is depicted by red, blue and green solid dots respectively. Black rod is the dimeric interface. Yellow star is the catalytic center. The three inset figure(s) demonstrate the secondary structure changes occurring during the course of activation explaining assembly (+) or disassembly (−) of calcium binding sites extracted from the Transition state intermediate models reported earlier.

References

    1. Varga-Szabo D, Braun A, Nieswandt B. Calcium signaling in platelets. Journal of Thrombosis and Haemostasis. 2009;7:1057–1066. doi: 10.1111/j.1538-7836.2009.03455.x. - DOI - PubMed
    1. Braun A, Vogtle T, Varga-Szabo D, Nieswandt B. STIM and Orai in hemostasis and thrombosis. Frontiers in bioscience (Landmark edition) 2011;16:2144–2160. doi: 10.2741/3844. - DOI - PubMed
    1. Ambrus A, et al. Calcium binding of transglutaminases: a 43Ca NMR study combined with surface polarity analysis. Journal of biomolecular structure & dynamics. 2001;19:59–74. doi: 10.1080/07391102.2001.10506720. - DOI - PubMed
    1. Lorand L, Losowsky MS, Miloszewski KJ. Human factor XIII: fibrin-stabilizing factor. Progress in hemostasis and thrombosis. 1980;5:245–290. - PubMed
    1. Schwartz ML, Pizzo SV, Hill RL, McKee PA. Human Factor XIII from plasma and platelets. Molecular weights, subunit structures, proteolytic activation, and cross-linking of fibrinogen and fibrin. The Journal of biological chemistry. 1973;248:1395–1407. - PubMed

Publication types