. 2019 Dec;13(12):2927-2937.
doi: 10.1038/s41396-019-0483-z. Epub 2019 Aug 5.

Selection for antimicrobial resistance is reduced when embedded in a natural microbial community

Affiliations

Selection for antimicrobial resistance is reduced when embedded in a natural microbial community

Uli Klümper et al. ISME J. 2019 Dec.

Abstract

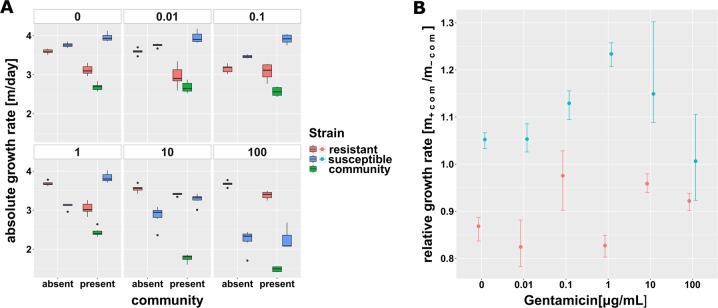
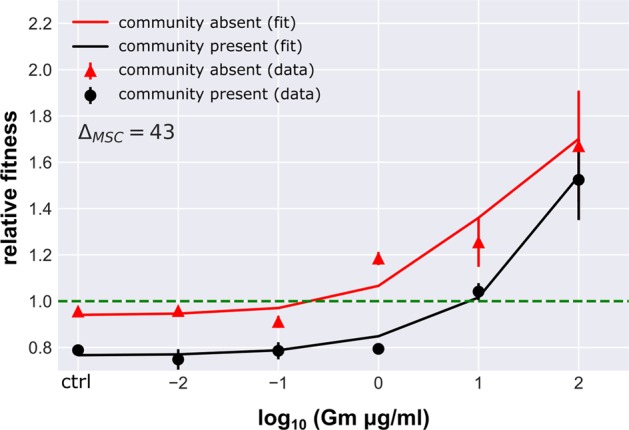
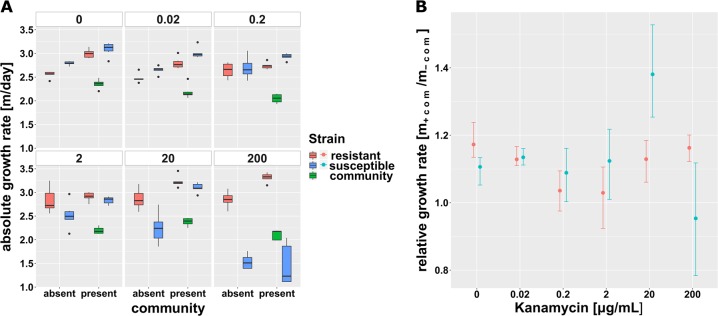
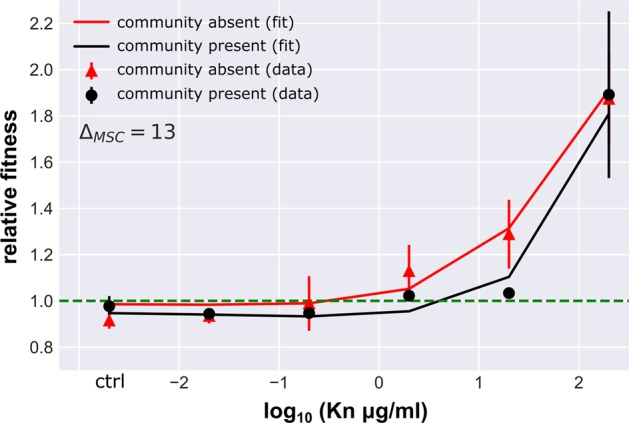
Antibiotic resistance has emerged as one of the most pressing, global threats to public health. In single-species experiments selection for antibiotic resistance occurs at very low antibiotic concentrations. However, it is unclear how far these findings can be extrapolated to natural environments, where species are embedded within complex communities. We competed isogenic strains of Escherichia coli, differing exclusively in a single chromosomal resistance determinant, in the presence and absence of a pig faecal microbial community across a gradient of antibiotic concentration for two relevant antibiotics: gentamicin and kanamycin. We show that the minimal selective concentration was increased by more than one order of magnitude for both antibiotics when embedded in the community. We identified two general mechanisms were responsible for the increase in minimal selective concentration: an increase in the cost of resistance and a protective effect of the community for the susceptible phenotype. These findings have implications for our understanding of the evolution and selection of antibiotic resistance, and can inform future risk assessment efforts on antibiotic concentrations.


Conflict of interest statement

The authors declare that they have no conflict of interest.

Figures

Fig. 1
Fig. 1
Malthusian growth parameter per day of the focal species’ isogenic strains for gentamicin. Values are displayed across the antibiotic gradient and in absence and presence of the gut microbial community. a Average (±SD, n = 6) logarithmic absolute growth per day for the resistant strain, the susceptible strain and the community. A different inoculum size of the focal species in absence (~106 bacteria) and presence (~105 bacteria = 10% of total inoculum) of the community was used. b Ratio of absolute Malthusian growth parameters (with 95% confidence intervals based on 1000-fold bootstrap analysis) in presence and absence of the microbial community across the gradient of antibiotic concentrations
Fig. 2
Fig. 2
Relative fitness of the gentamicin resistant strain. Values (mean ± SD, n = 6) in presence (black) and absence (red) of the community. Solid lines represent the best fit fitness curve through the mathematical model based on parameter estimates presented in Table 1. The dashed line indicates neutral selection at a relative fitness of ρr = 1, where the intercept with the fitness curve indicates the minimal selective concentration
Fig. 3
Fig. 3
Malthusian growth parameter per day of the focal species’ isogenic strains for kanamycin. Values are displayed across the antibiotic gradient and in absence and presence of the gut microbial community. a Average (±SD, n = 6) logarithmic absolute growth per day for the resistant (red), the susceptible strain and the community. A different inoculum size of the focal species in absence (~106 bacteria) and presence (~105 bacteria = 10% of total inoculum) of the community was used. b Ratio of absolute Malthusian growth parameters (with 95% confidence intervals based on 1000-fold bootstrap analysis) in the presence and absence of the microbial community across the gradient of antibiotic concentrations
Fig. 4
Fig. 4
Relative fitness of the kanamycin resistant strain. Values (mean ± SD, n = 6) in the presence (black) and absence (red) of the community. Solid lines represent the best fit fitness curve through the mathematical model based on parameter estimates presented in Table 2. The dashed line indicates neutral selection at a relative fitness of ρr = 1, where the intercept with the fitness curve indicates the minimal selective concentration
Fig. 5
Fig. 5
Detected resistance genes. Type (a) and aminoglycoside subtype (b) relative abundance (resistance gene number normalized with 16S rRNA gene copy number), in original faecal community and in final reactor community at three kanamycin concentrations (mean ± SD; nfaeces = 2, nKn0 = 6, nKn2 = 6 nKn20 = 5). Only genes detected with the ARGs-OAP pipeline are shown. MLS = Macrolides, Lincosamides, Streptogramines

Comment in

References

    1. WHO. Antimicrobial Resistance Global Report on Surveillance. 2014. https://www.who.int/drugresistance/documents/surveillancereport/en/.
    1. D’Costa VM, King CE, Kalan L, Morar M, Sung WWL, Schwarz C, et al. Antibiotic resistance is ancient. Nature. 2011;477:457–61. doi: 10.1038/nature10388. - DOI - PubMed
    1. Knapp CW, Dolfing J, Ehlert PAI, Graham DW. Evidence of increasing antibiotic resistance gene abundances in archived soils since 1940. Environ Sci Technol. 2010;44:580–7. doi: 10.1021/es901221x. - DOI - PubMed
    1. Drlica K. The mutant selection window and antimicrobial resistance. J Antimicrob Chemother. 2003;52:11–7. doi: 10.1093/jac/dkg269. - DOI - PubMed
    1. Drlica K, Zhao X. Mutant selection window hypothesis updated. Clin Infect Dis. 2007;44:681–8. doi: 10.1086/511642. - DOI - PubMed

Publication types

Substances