. 2019 Dec;13(12):2901-2915.
doi: 10.1038/s41396-019-0485-x. Epub 2019 Aug 5.

Tundra microbial community taxa and traits predict decomposition parameters of stable, old soil organic carbon

Affiliations

Tundra microbial community taxa and traits predict decomposition parameters of stable, old soil organic carbon

Lauren Hale et al. ISME J. 2019 Dec.

Abstract

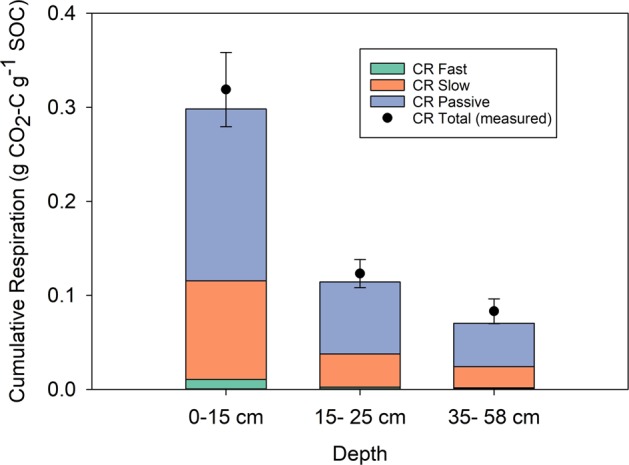
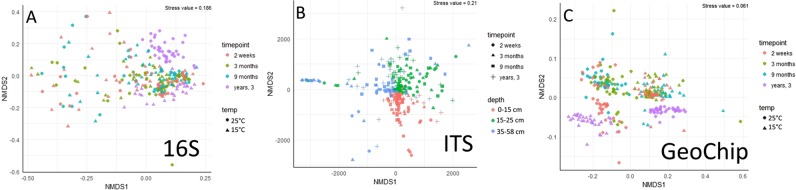
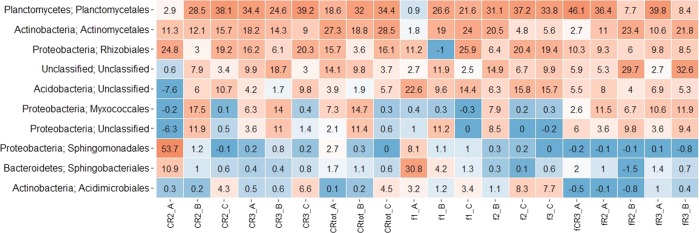
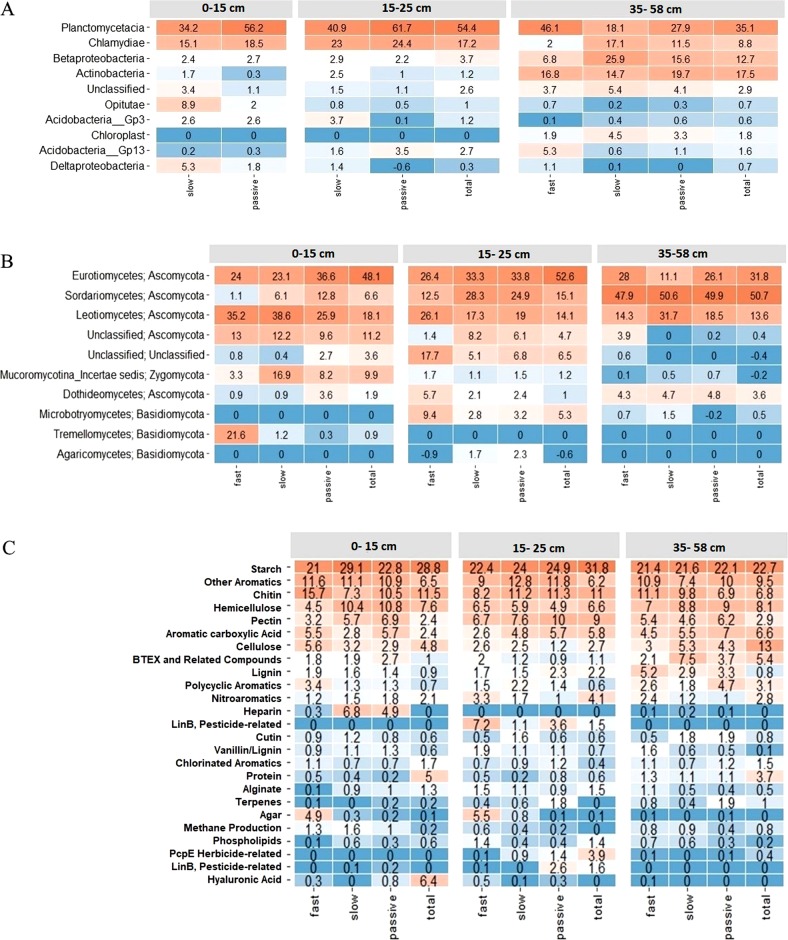
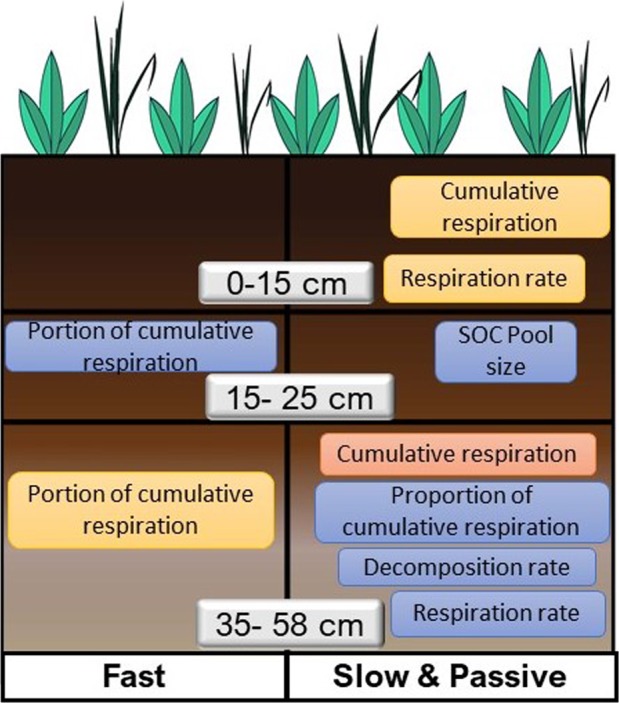
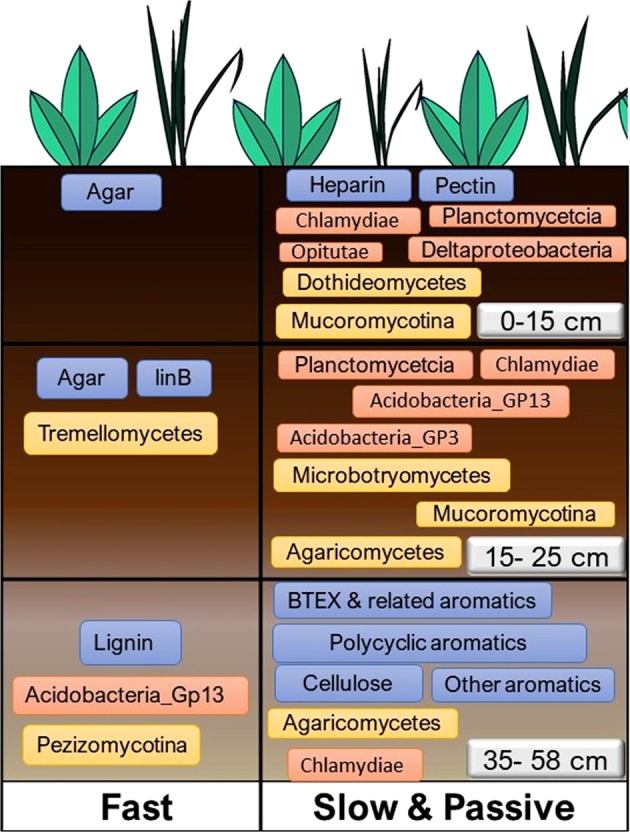
The susceptibility of soil organic carbon (SOC) in tundra to microbial decomposition under warmer climate scenarios potentially threatens a massive positive feedback to climate change, but the underlying mechanisms of stable SOC decomposition remain elusive. Herein, Alaskan tundra soils from three depths (a fibric O horizon with litter and course roots, an O horizon with decomposing litter and roots, and a mineral-organic mix, laying just above the permafrost) were incubated. Resulting respiration data were assimilated into a 3-pool model to derive decomposition kinetic parameters for fast, slow, and passive SOC pools. Bacterial, archaeal, and fungal taxa and microbial functional genes were profiled throughout the 3-year incubation. Correlation analyses and a Random Forest approach revealed associations between model parameters and microbial community profiles, taxa, and traits. There were more associations between the microbial community data and the SOC decomposition parameters of slow and passive SOC pools than those of the fast SOC pool. Also, microbial community profiles were better predictors of model parameters in deeper soils, which had higher mineral contents and relatively greater quantities of old SOC than in surface soils. Overall, our analyses revealed the functional potential of microbial communities to decompose tundra SOC through a suite of specialized genes and taxa. These results portray divergent strategies by which microbial communities access SOC pools across varying depths, lending mechanistic insights into the vulnerability of what is considered stable SOC in tundra regions.


Conflict of interest statement

The authors declare that they have no conflict of interest.

Figures

Fig. 1
Fig. 1
Stacked bar plots show estimated cumulative respiration (CR) from each SOC pool and total measured cumulative respiration over the 3-year incubation. Estimated CR from the decomposition of the fast, slow and passive SOC pools were calculated using a 3-pool model. Measured CR corresponds to the CR quantified during the incubation. Data are from samples incubated at 15 °C. The samples incubated at 25 °C follow the same trend (not shown here, but data provided in Table S2)
Fig. 2
Fig. 2
Non-metric multidimensional scaling plots of community profiles. Clustering of bacterial/ archaeal communities (16S) by timepoint and incubation temperature (a); fungal communities (ITS) by timepoint and depth (b); functional gene profiles (GeoChip) by timepoint and incubation temperature (c)
Fig. 3
Fig. 3
Heatmap of importance (%IncMSE) of bacterial classes and genera to predicting model parameters. Model parameters presented had ≥30% variance explained by 16S profiles. Model parameters are cumulative CO2 respiration from the slow (CR2) and passive (CR3) SOC pools, and total (CRtot); relative pool sizes of the fast (f1), slow (f2), and passive (f3) SOC pools, percentage of the cumulative CO2 respiration from the decomposition of the passive (fCR3) SOC pool, and percentages of the respiration rate from the decomposition of slow (fR2) and passive (fR3) SOC pools. SOC parameters are split by depth (A = 0–15 cm, B = 15–25 cm, C = 35–58 cm)
Fig. 4
Fig. 4
Heatmaps of importance (%IncMSE) of bacterial classes (a), fungal classes (b) or GeoChip probes, categorized by C substrate target (c) to predicting categorized model parameters (fast, slow, passive, or total) over depth. Importance values were output from Random Forest analyses
Fig. 5
Fig. 5
Model parameters for each depth that were predicted by one of the three community profiles, bacterial/archaeal (pink); fungal (yellow); or C decomposition functional genes (blue). These results are based on associations deemed significant using both a Random Forest approach (≥30% of the model parameter variance was explained by the community profile) and multiple regression on distance matrices (MRM) analyses (P < 0.05)
Fig. 6
Fig. 6
Bacterial/archaeal classes (pink), fungal classes (yellow), and functional gene substrate targets (blue) associated with relatively available SOC (fast model parameters) vs relatively stable SOC (slow and passive model parameters). Predictor importance was assigned to each class or gene probe category for all model parameters with ≥30% variance explained by the corresponding 16S, ITS, or GeoChip profile based on Random Forest analysis. Predictor importance was used to generate heatmaps with fast, slow, and passive groupings for the SOC parameters. A class or probe category was deemed important to prediction of an SOC category if heat map values were ≥4 (16S and ITS) or ≥5 (GeoChip). Only classes and substrates that met this threshold uniquely for either the fast SOC category or the slow/ passive categories are presented here

References

    1. Koven CD, Riley WJ, Stern A. Analysis of permafrost thermal dynamics and response to climate change in the CMIP5 Earth System Models. J Clim. 2013;26:1877–900. doi: 10.1175/JCLI-D-12-00228.1. - DOI
    1. Schuur E, Abbott B, Bowden W, Brovkin V, Camill P, Canadell J, et al. Expert assessment of vulnerability of permafrost carbon to climate change. Clim Change. 2013;119:359–74. doi: 10.1007/s10584-013-0730-7. - DOI
    1. Schuur E, McGuire AD, Schädel C, Grosse G, Harden J, Hayes D, et al. Climate change and the permafrost carbon feedback. Nature. 2015;520:171. doi: 10.1038/nature14338. - DOI - PubMed
    1. Schuur EA, Bockheim J, Canadell JG, Euskirchen E, Field CB, Goryachkin SV, et al. Vulnerability of permafrost carbon to climate change: Implications for the global carbon cycle. AIBS Bull. 2008;58:701–14.
    1. Belshe E, Schuur E, Bolker B. Tundra ecosystems observed to be CO2 sources due to differential amplification of the carbon cycle. Ecol Lett. 2013;16:1307–15. doi: 10.1111/ele.12164. - DOI - PubMed

Publication types