. 2019 Sep;20(9):1208-1219.
doi: 10.1038/s41590-019-0442-x. Epub 2019 Aug 5.

Functional reprogramming of regulatory T cells in the absence of Foxp3

Affiliations

Functional reprogramming of regulatory T cells in the absence of Foxp3

Louis-Marie Charbonnier et al. Nat Immunol. 2019 Sep.

Abstract

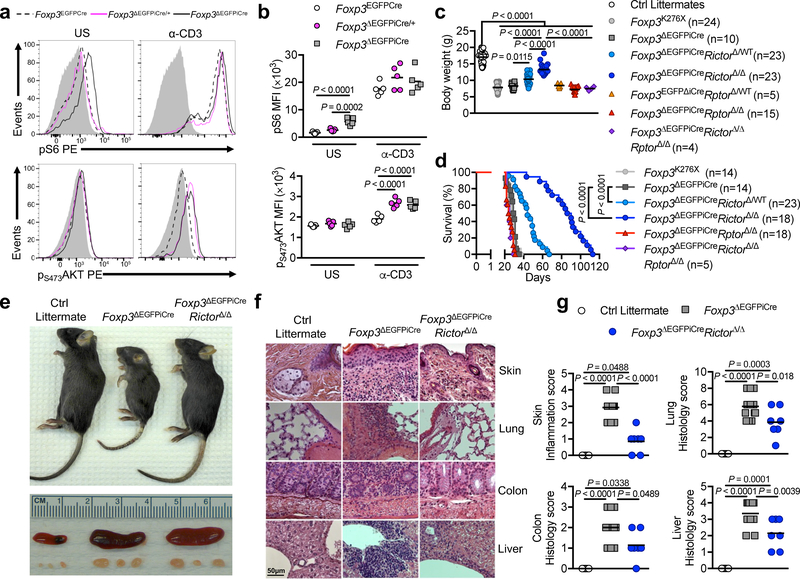
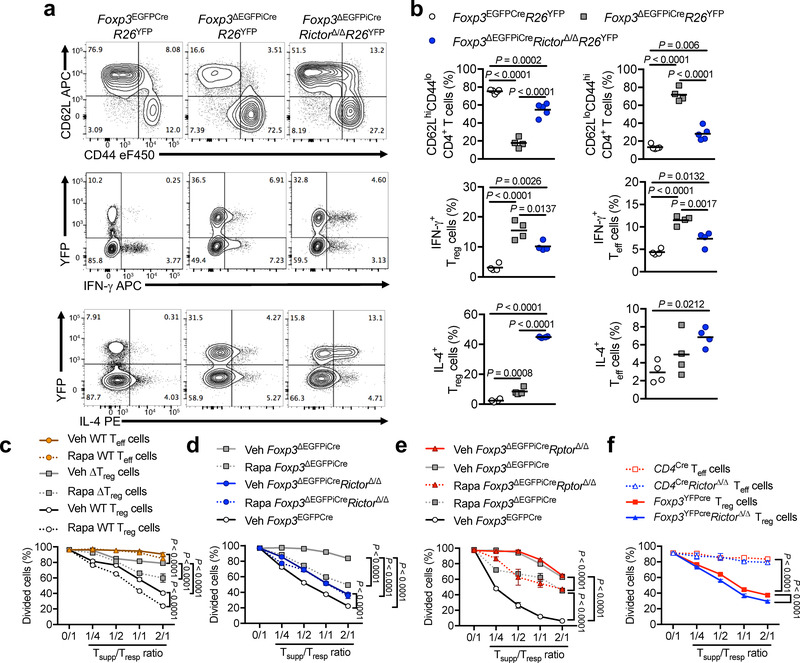
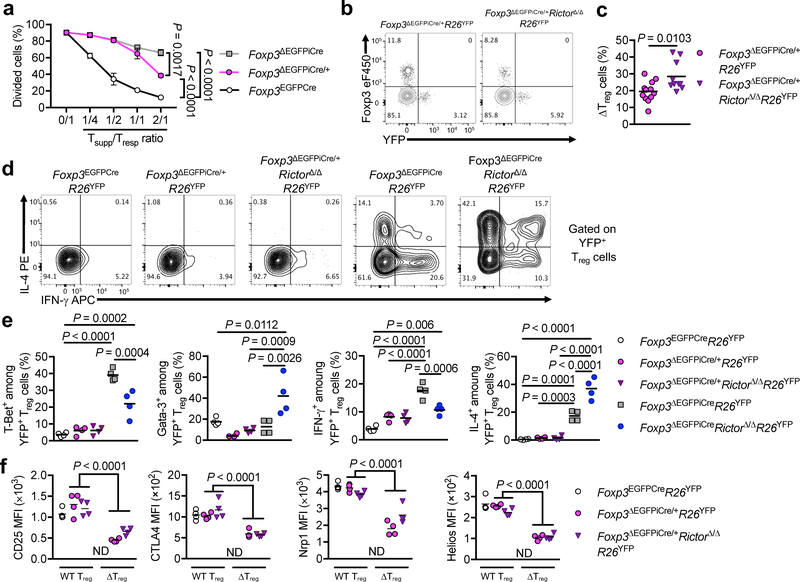
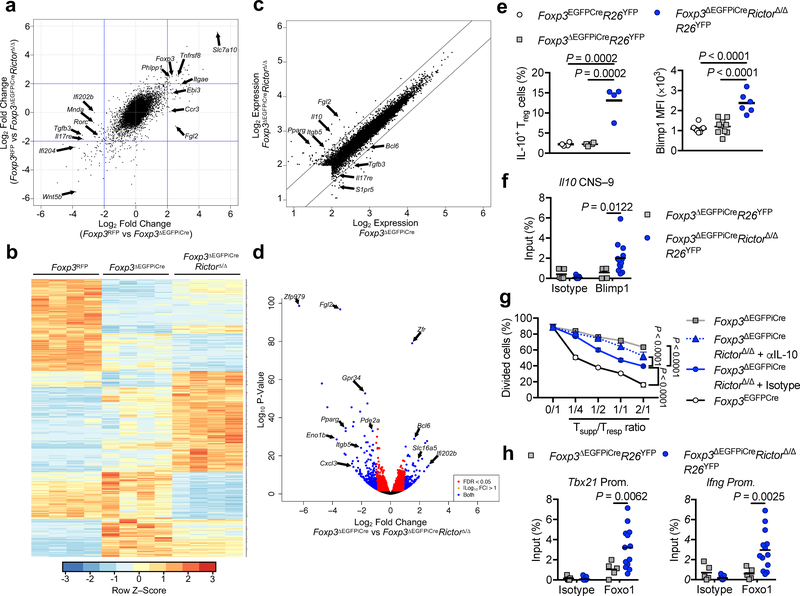
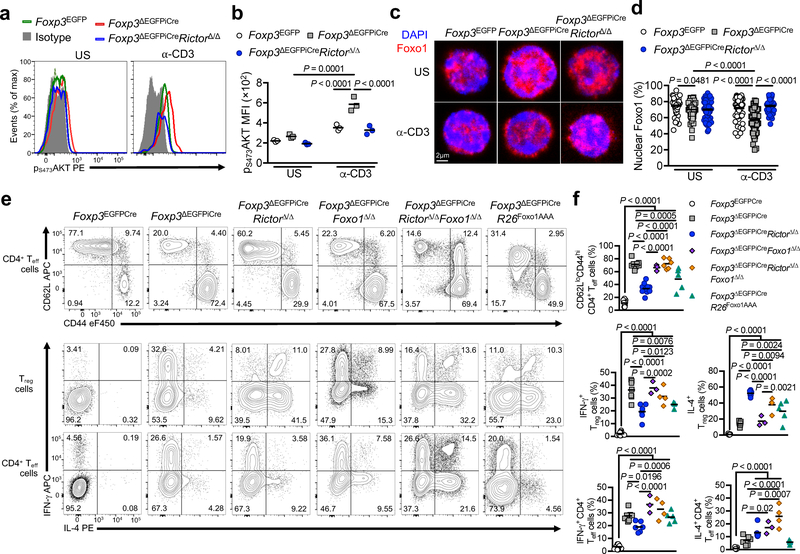
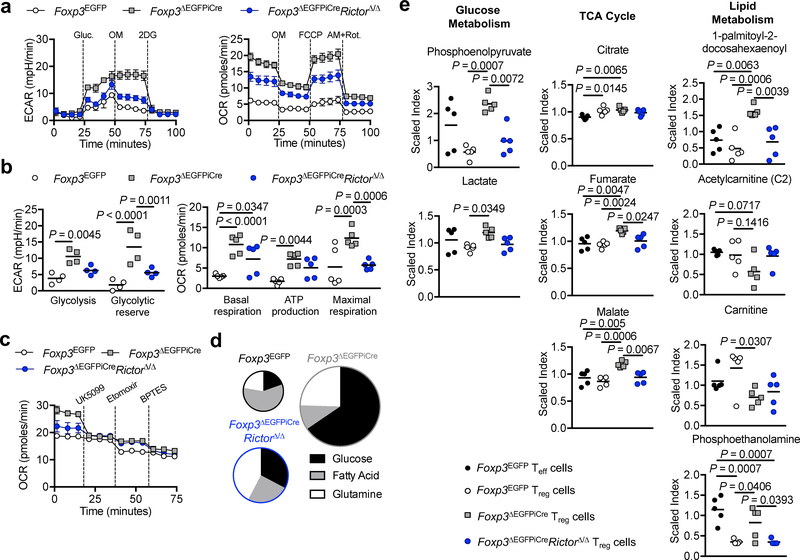
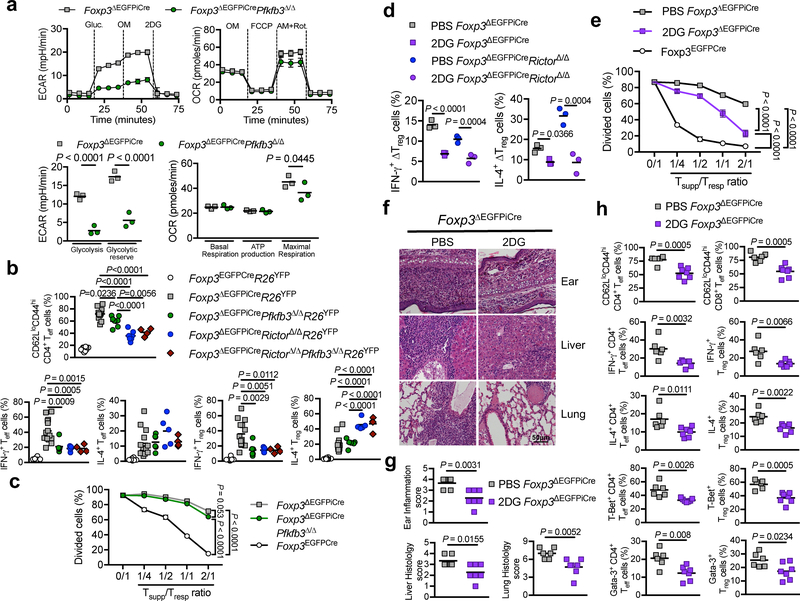
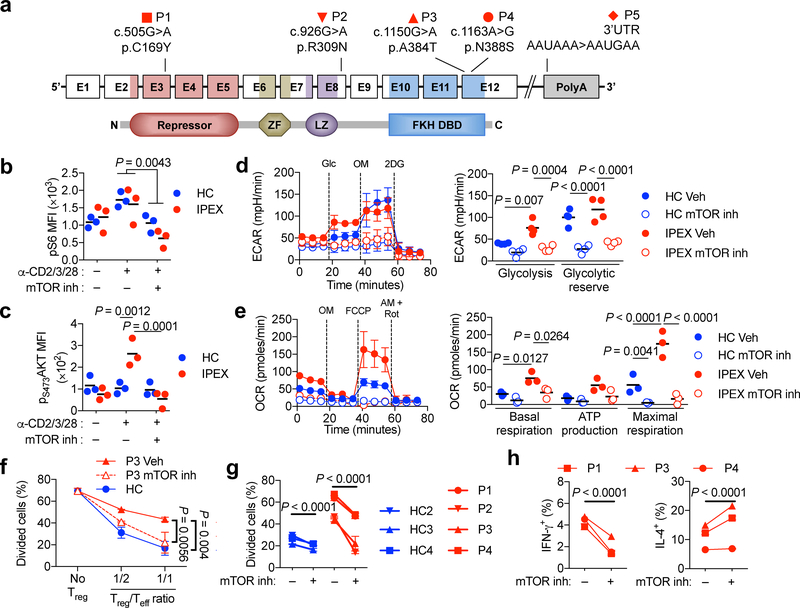
Regulatory T cells (Treg cells) deficient in the transcription factor Foxp3 lack suppressor function and manifest an effector T (Teff) cell-like phenotype. We demonstrate that Foxp3 deficiency dysregulates metabolic checkpoint kinase mammalian target of rapamycin (mTOR) complex 2 (mTORC2) signaling and gives rise to augmented aerobic glycolysis and oxidative phosphorylation. Specific deletion of the mTORC2 adaptor gene Rictor in Foxp3-deficient Treg cells ameliorated disease in a Foxo1 transcription factor-dependent manner. Rictor deficiency re-established a subset of Treg cell genetic circuits and suppressed the Teff cell-like glycolytic and respiratory programs, which contributed to immune dysregulation. Treatment of Treg cells from patients with FOXP3 deficiency with mTOR inhibitors similarly antagonized their Teff cell-like program and restored suppressive function. Thus, regulatory function can be re-established in Foxp3-deficient Treg cells by targeting their metabolic pathways, providing opportunities to restore tolerance in Treg cell disorders.


Conflict of interest statement

Competing interests statement

The authors declare no competing interests.

Figures

Figure 1.
Figure 1.. Inactivation of mTORC2 but not mTORC1 in ΔTreg cells mitigates Foxp3 deficiency.
(a,b) Representative flow cytometric analysis (a) and mean fluorescence intensity (MFI) (b) of phosphorylated S6 (pS6) and phosphorylated AKT at Ser473 residu (pS473AKT) expression of unstimulated (US) or anti-CD3 stimulated (α-CD3) Treg cells from Foxp3EGFPCre, Foxp3ΔEGFPiCre/+ and Foxp3ΔEGFPiCre mice (n=5 per group). Results represent 1 of 3 independent experiments. (c,d) Body weight at 25–28 days of age (c) and survival (d) of Foxp3K276X, Foxp3ΔEGFPiCre, Foxp3ΔEGFPiCreRictorΔ/WT, Foxp3ΔEGFPiCreRictorΔ/Δ, Foxp3ΔEGFPiCreRptorΔ/WT, Foxp3ΔEGFPiCreRptorΔ/Δ, Foxp3ΔEGFPiCreRictorΔ/ΔRptorΔ/Δ mice and control littermates. Results represent a pool of 5 independent experiments. (e) Gross appearance of Foxp3ΔEGFPiCre, Foxp3ΔEGFPiCreRictorΔ/Δ and control littermate and their respective spleens and peripheral lymph nodes. (f,g) Representative microscopic pictures of H&E staining (original magnification ×200) (f) and histological scores (g) of skin, lung, colon and liver of Foxp3ΔEGFPiCre (n=14), Foxp3ΔEGFPiCreRictorΔ/Δ (n=7) and control littermates (n=5). Results represent a pool of 3 independent experiments. Statistical significance was determined by a one-way ANOVA with Tukey’s multiple comparisons (c, g), two-way ANOVA with Sidak’s multiple comparisons (b) and log rank test (d) (P values as indicated).
Figure 2.
Figure 2.. mTORC2 blockade endows ΔTreg cells with regulatory function.
(a,b) Representative flow cytometric analysis (a) and frequencies (scatter plots with mean) (b) of CD62LhiCD44lo and CD62LloCD44hi CD4+ T cells or IFN-γ and IL-4 expression by CD4+ Treg (YFP+) and Teff (YFP) cells from spleen of Foxp3EGFPCreR26YFP (n=5 for CD62LhiCD44lo and CD62LloCD44hi CD4+ T cells, n=4 for IFN-γ and IL-4 expression), Foxp3ΔEGFPiCreR26YFP (n=4) and Foxp3ΔEGFPiCreRictorΔ/ΔR26YFP mice (n=5 for CD62LhiCD44lo and CD62LloCD44hi CD4+ T cells, n=4 for IFN-γ and IL-4 expression). Results represent 1 of 4 independent experiments (c) In vitro suppression of the proliferation of WT CD4+ Teff cells (denoted as T responder or Tresp) by Foxp3EGFPCre Teff cells pre-treated for 1h with DMSO (Veh WT Teff cells) or 1μM Rapamycin (Rapa WT Teff cells), Foxp3EGFPCre Treg cells pre-treated for 1h with DMSO (Veh WT Treg cells) or 1μM Rapamycin (Rapa WT Treg cells) or Foxp3ΔEGFPiCre Treg cells pre-treated for 1h with DMSO (Veh ΔTreg cells) or 1μM Rapamycin (Rapa ΔTreg cells) (denoted as T suppressor or Tsupp) (n=3 per group). Results represent 1 of 3 independent experiments (d, e) In vitro suppression of Tresp cells by Foxp3EGFPCre Treg cells (Foxp3EGFPCre), Foxp3ΔEGFPiCre Treg cells pre-treated for 1h with DMSO (Veh Foxp3ΔEGFPiCre) or 1μM Rapamycin (Rapa Foxp3ΔEGFPiCre), Foxp3ΔEGFPiCreRictorΔ/Δ Treg cells pre-treated for 1h with DMSO (Veh Foxp3ΔEGFPiCreRictorΔ/Δ) or 1μM Rapamycin (Rapa Foxp3ΔEGFPiCreRictorΔ/Δ) (n=3 per group) (Results represent 1 of 3 independent experiments) (d), and Foxp3ΔEGFPiCreRptorΔ/Δ Treg cells pre-treated for 1h with DMSO (Veh Foxp3ΔEGFPiCreRptorΔ/Δ) or 1μM Rapamycin (Rapa Foxp3ΔEGFPiCreRptorΔ/Δ) (n=3 per group) (Results represent 1 of 3 independent experiments) (e). (f) In vitro suppression of Tresp cells by Rictor-sufficient or -deficient Teff (CD4+CD25 cells from CD4cre and CD4creRictorΔ/Δ) and Foxp3-sufficient Treg (Foxp3YFPcre and Foxp3YFPcreRictorΔ/Δ) cells (n=3 per group) (Results represent 1 of 2 independent experiments). Results are expressed as mean ± SEM in panels c-f. Statistical significance was determined by a one-way ANOVA (b) or two-way ANOVA with Tukey’s multiple comparisons (c-f) (P values as indicated).
Figure 3:
Figure 3:. Cell intrinsic and extrinsic determinants of the Teff cell-like phenotype of ΔTreg cells.
(a) In vitro suppression of CD4+ Teff cell (Tresp) proliferation by Foxp3-sufficient Treg cells from Foxp3EGFPcre mice and ΔTreg cells from Foxp3ΔEGFPiCre/+ and Foxp3ΔEGFPiCre mice (Tsupp) (n=3 per group). Results are expressed as mean ± SEM and represent 1 of 2 independent experiments. (b, c) Representative flow cytometric analysis of Foxp3 and YFP among CD4+ T cells (b) and frequencies of ΔTreg cells (c) among total Treg cells from Foxp3ΔEGFPiCre/+R26YFP (n=12) and Foxp3ΔEGFPiCre/+RictorΔ/ΔR26YFP (n=10) mice. Results are expressed as scatter plot and mean and represent a pool of 3 independent experiments. (d, e) Representative flow cytometric analysis of IL-4 and IFN-γ among YFP+ Treg cells (d) and frequencies (Scatter plot and mean) of T-Bet+, Gata-3+, IFN-γ+ and IL-4+ YFP+ Treg cells (e) from Foxp3EGFPCreR26YFP, Foxp3ΔEGFPiCre/+R26YFP, Foxp3ΔEGFPiCre/+RictorΔ/ΔR26YFP, Foxp3ΔEGFPiCreR26YFP and Foxp3ΔEGFPiCreRictorΔ/ΔR26YFP mice (n=4 per group). Results represent 1 of 2 independent experiments. (f) CD25, CTLA4, Nrp1 and Helios MFI in WT Treg and ΔTreg cells from Foxp3EGFPCreR26YFP, Foxp3ΔEGFPiCre/+R26YFP, Foxp3ΔEGFPiCre/+RictorΔ/ΔR26YFP female mice (n=4 per group). ND, Not Determined. Results represent 1 of 2 independent experiments. Statistical significance was determined by unpaired t-test (c), one-way ANOVA (e) or two-way ANOVA (a, f) with Tukey’s multiple comparisons (P values as indicated).
Figure 4.
Figure 4.. mTORC2-dependent and -independent gene expression profiles in ΔTreg cells.
Gene expression profiles of Foxp3RFP (WT), Foxp3ΔEGFPiCre and Foxp3ΔEGFPiCreRictorΔ/Δ Treg cells (n=4 per group) isolated from spleen of Foxp3RFP/ΔEGFPiCreR26YFP and Foxp3ΔEGFPiCre/+RictorΔ/ΔR26YFP female mice. (a), Gene expression profiles represented as Fold change (Foxp3RFP vs Foxp3ΔEGFPiCre) versus Fold change (Foxp3RFP vs Foxp3ΔEGFPiCreRictorΔ/Δ). (b), Heatmap representation, (c), Log2 expression and (d) volcano plot of differential gene expression in Foxp3ΔEGFPiCre versus Foxp3ΔEGFPiCreRictorΔ/Δ ΔTreg cells. FDR, false discovery rate; log2FC, log2(fold change). (e), Flow cytometric analysis of IL-10 and Blimp1 expression in Treg cells of Foxp3EGFPCre (n=4 and n=8 respectively) and ΔTreg cells of Foxp3ΔEGFPiCre (n=4 and n=10 respectively) and Foxp3ΔEGFPiCreRictorΔ/Δ (n=4 and n=6 respectively) mice. Results are expressed as scatter plot and mean and represent 1 of 3 independent experiments. (f), Chromatin immunoprecipitation (ChIP) assay for the binding of Blimp1 and control isotype to the Il10 conserved non-coding sequence located 9kb in proximal of il10 promoter (il10 CNS–9) in Foxp3ΔEGFPiCre (n=5) and Foxp3ΔEGFPiCreRictorΔ/Δ (n=13) ΔTreg cells. Results are expressed as scatter plot and mean and represent a pool of 2 independent experiments. (g), In vitro suppression of Tresp cells by Foxp3ΔEGFPiCreRictorΔ/Δ ΔTreg cells carried out in the presence of either an isotype control or anti-IL-10 mAb (n=3 per group). Results are expressed as mean ± SEM and represent 1 of 2 independent experiments. (h) ChIP assays for the binding of Foxo1 and control isotype to Tbx21 and Ifng promoters in Foxp3ΔEGFPiCre (n=5) and Foxp3ΔEGFPiCreRictorΔ/Δ (n=13) ΔTreg cells. Results are expressed as scatter plot and mean and represent a pool of 2 independent experiments. Statistical significance was determined one-way ANOVA (e) or two-way ANOVA (f-h) with Tukey’s or Sidak’s multiple comparisons (P values as indicated).
Figure 5.
Figure 5.. Contribution of AKT/Foxo1 axis to the Rictor-dependent ΔTreg cell phenotype.
(a) Representative flow cytometric analysis and (b) MFI of p473-AKT expression in unstimulated (US) and anti-CD3/CD28 mAb-stimulated (α-CD3+α-CD28) Treg cells from Foxp3EGFPCre, Foxp3ΔEGFPiCre, Foxp3ΔEGFPiCreRictorΔ/Δ mice (n=3 per group). Results are expressed as scatter plot and mean and represent 1 of 3 independent experiments. (c,d) Representative confocal microscopic merge image of Foxo1 (Red) and DAPI (Blue) (c), and percent of nuclear Foxo1 (d) in unstimulated (US) or 0.1μg/mL anti-CD3 (α-CD3) stimulated Treg cells from Foxp3EGFPCre (n=53 for US, n=71 for α-CD3), Foxp3ΔEGFPiCre (n=74 for US, n=95 for α-CD3), Foxp3ΔEGFPiCreRictorΔ/Δ (n=78 for US, n=46 for α-CD3) mice. Results are expressed as scatter plot and mean and represent a pool of 2 independent experiments. (e) Representative flow cytometric analysis and (f) frequencies (scatter plot and mean) of CD62LloCD44hi CD4+ Teff cells, and IFN-γ and IL-4 expression by CD4+ Treg and Teff cells in spleens of Foxp3EGFPCre (n=10), Foxp3ΔEGFPiCre (n=7), Foxp3ΔEGFPiCreRictorΔ/Δ (n=6), Foxp3ΔEGFPiCreFoxo1Δ/Δ (n=3), Foxp3ΔEGFPiCreRictorΔ/ΔFoxo1Δ/Δ (n=4) and Foxp3ΔEGFPiCreR26Foxo1AAA (n=5) mice. Results represent a pool of 3 independent experiments. Statistical significance was determined one-way ANOVA with Tukey’s multiple comparisons (f) or two-way ANOVA with Sidak’s multiple comparisons (b, d) (P values as indicated).
Figure 6.
Figure 6.. mTORC2 promotes aerobic glycolysis and OXPHOS in ΔTreg cells.
(a, b) Extracellular acidification rate (ECAR) under glycolysis stress test conditions (n=4 per group) and Oxygen consumption rate (OCR) under mitochondrial stress test conditions (n=5 per group) of Treg/ΔTreg cells isolated from Foxp3EGFP, Foxp3ΔEGFPiCre or Foxp3ΔEGFPiCreRictorΔ/Δ males (n=4 per group). Results are expressed as mean ± SEM and represent a pool of 2 independent experiments. (c) OCR under mitochondrial fuel test conditions (n=4 per group). Results are expressed as mean ± SEM and represent a pool of 2 independent experiments (d) Pie chart representation of the contribution of glucose, fatty acids and glutamine to the OXPHOS capacities in Foxp3EGFP, Foxp3ΔEGFPiCre and Foxp3ΔEGFPiCreRictorΔ/Δ ΔTreg cells. (e) Quantification of metabolites (expressed as scaled index) of glucose metabolism (Phosphoenolpyruvate and lactate), tricarboxylic acid (TCA) cycle (Citrate, fumarate and Malate) and lipid metabolism (Acetylcarnitine (C2), Carnitine, 1-palmitoyl-2-decosahexaenoyl and Phospho-ethanolamine) isolated from Foxp3EGFP, Foxp3ΔEGFPiCre and Foxp3ΔEGFPiCreRictorΔ/Δ ΔTreg cells (n=5 per group). Results are expressed as mean ± SEM and represent 1 experiment. Statistical significance was determined one-way ANOVA with Tukey’s multiple comparisons (e) or two-way ANOVA with Sidak’s multiple comparisons (b) (P values as indicated).
Figure 7.
Figure 7.. Blockade of glycolysis improves the scurfy phenotype of Foxp3ΔEGFPiCre mice.
(a) ECAR under glycolysis stress test conditions and OCR under mitochondrial stress test conditions of ΔTreg cells isolated from Foxp3ΔEGFPiCre or Foxp3ΔEGFPiCrePfkfb3Δ/Δ males (n=3 per group). Results are expressed as mean ± SEM and represent 1 of 2 independent experiments. (b) Frequencies of CD62LloCD44hi CD4+ Teff cells, and IFN-γ and IL-4 expression by CD4+ Treg and Teff cells in spleens of Foxp3EGFPCreR26YFP, Foxp3ΔEGFPiCreR26YFP, Foxp3ΔEGFPiCrePfkfb3Δ/ΔR26YFP, Foxp3ΔEGFPiCreRictorΔ/ΔR26YFP, Foxp3ΔEGFPiCreRictorΔ/ΔPfkfb3Δ/ΔR26YFP mice. Results are expressed as scatter plot and mean and represent a pool of 3 independent experiments. (c) In vitro suppression of CD4+ Teff cell (Tresp) proliferation by Foxp3EGFPCre, Foxp3ΔEGFPiCre or Foxp3ΔEGFPiCrePfkfb3Δ/Δ Treg cells (Tsupp) (n=3 per group). Results are expressed as mean ± SEM and represent 1 of 2 independent experiments. (d) Frequencies of IFN-γ+ and IL-4+ Foxp3ΔEGFPiCreR26YFP and Foxp3ΔEGFPiCreRictorΔ/ΔR26YFP sorted Treg cells that were either sham treated or treated ex-vivo with 2-deoxyglucose (2DG) (n=3 per group). Results are expressed as scatter plot and mean and represent 1 of 2 independent experiments. (e) In vitro suppression of CD4+ Teff cell (Tresp) proliferation by Foxp3ΔEGFPiCre ΔTreg (Tsupp) cells that were pre-treated for 12h with either PBS (Veh ΔTreg cells) or 2DG (2DG ΔTreg cells) (n=3 per group). Results are expressed as mean ± SEM and represent 1 of 2 independent experiments. (f, g) Representative hematoxylin and eosin-stained tissue histological sections (f) and tissue histological scores (g) of ears, livers and lungs of Foxp3ΔEGFPiCreR26YFP mice treated with PBS (n=) or 2 μg/g 2DG (n=) every other day from day 14 to day 28. Results are expressed as scatter plot and mean and represent a pool of 2 independent experiments. (h) Frequencies of CD62LloCD44hi CD4+ and CD8+ Teff cells, IFN-γ+ and IL-4+ Treg and CD4+ Teff cells and T-Bet+ and Gata-3+ Treg and CD4+ Teff cells in Foxp3ΔEGFPiCreR26YFP mice treated with PBS (n=6) or 2DG (n=7). Results are expressed as scatter plot and mean and represent a pool of 2 independent experiments. Statistical significance was determined unpaired t-test (g, h), one-way ANOVA with Tukey’s multiple comparisons (b) or two-way ANOVA with Sidak’s multiple comparisons (a, d) or with Tukey’s multiple comparisons (c, e) (P values as indicated).
Figure 8.
Figure 8.. mTOR inhibition augments the suppressive function of human FOXP3 mutant Treg cells.
(a) Schematic representation of FOXP3 illustrating the exons, the protein domains and mapped mutations of five patients. Amino acid changes are referred to by their single letter code. The N-terminal proline rich repressor domain (Repressor), zinc finger (ZF) motif, leucine zipper domain (LZ) and the forkhead DNA-binding domain (FKH DBD) are indicated. (b,c) Mean Fluorescence Intensity (MFI) of pS6 and pS473AKT in Treg cells of healthy control subjects (HC) (n=3) and IPEX patients (n=3; P1, P2, P3) stimulated with anti-CD2/CD3/CD28 mAbs (α-CD2/3/28) in the absence or presence of a competitive dual mTOR inhibitor (mTOR inh). Results are expressed as scatter plot and mean and represent 1 of 2 independent experiments. (c) Representative ECAR tracings (HC1 and P1), expressed as mean ± SEM. (d) Evaluation of glycolysis and glycolytic reserve (n=5 each for HC and IPEX groups). Results are expressed as mean ± SEM and represent a pool of 5 independent experiments. (e) Representative OCR tracings (HC2 and P2). Basal respiration, ATP production and maximal respiration in DMSO (Vehicle) or mTOR inhibitor (mTOR inh) treated HC and IPEX Treg cells (HC n=3 and IPEX: P1, P2, P4). (f) In vitro suppression of third party CD4+ Teff cell (Tresp) proliferation by Treg (Tsupp) cells of a HC or an IPEX subject (P3) that were pre-treated with vehicle or mTOR inhibitor. (g) Compilation of in vitro suppression assay results for HC and IPEX subjects at the ratio of 1:1 Treg:Teff cells without or with Treg cell mTOR inhibitor pretreatment. (h) IFN-γ and IL-4 secretion by vehicle or mTOR inhibitor pre-treated IPEX Treg cells. Statistical significance was one-way ANOVA with Tukey’s multiple comparisons (h) or two-way ANOVA with Sidak’s multiple comparisons (b-d) or with Tukey’s multiple comparisons (e, f, g) (P values as indicated).

Comment in

  • A metabolic peace process.
    Bordon Y. Bordon Y. Nat Rev Immunol. 2019 Oct;19(10):597. doi: 10.1038/s41577-019-0212-x. Nat Rev Immunol. 2019. PMID: 31399705 No abstract available.

Similar articles

Cited by

References

    1. Josefowicz SZ, Lu LF & Rudensky AY Regulatory T cells: mechanisms of differentiation and function. Annu Rev Immunol 30, 531–564 (2012). - PMC - PubMed
    1. Nutsch KM & Hsieh CS T cell tolerance and immunity to commensal bacteria. Curr Opin Immunol 24, 385–391 (2012). - PMC - PubMed
    1. Lin W et al. Regulatory T cell development in the absence of functional Foxp3. Nat Immunol 8, 359–368 (2007). - PubMed
    1. Gavin MA et al. Foxp3-dependent programme of regulatory T-cell differentiation. Nature 445, 771–775 (2007). - PubMed
    1. Ohkura N et al. T cell receptor stimulation-induced epigenetic changes and Foxp3 expression are independent and complementary events required for Treg cell development. Immunity 37, 785–799 (2012). - PubMed

Publication types

MeSH terms

Substances