. 2019 Jul 26;10(4):2041669519856906.
doi: 10.1177/2041669519856906. eCollection 2019 Jul-Aug.

Reversed Phi and the "Phenomenal Phenomena" Revisited

Affiliations

Reversed Phi and the "Phenomenal Phenomena" Revisited

Brian Rogers et al. Iperception. .

Abstract

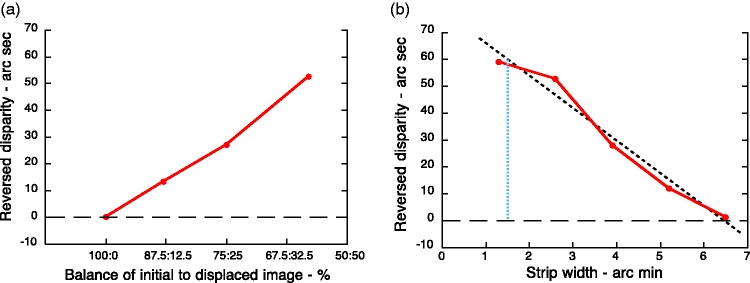
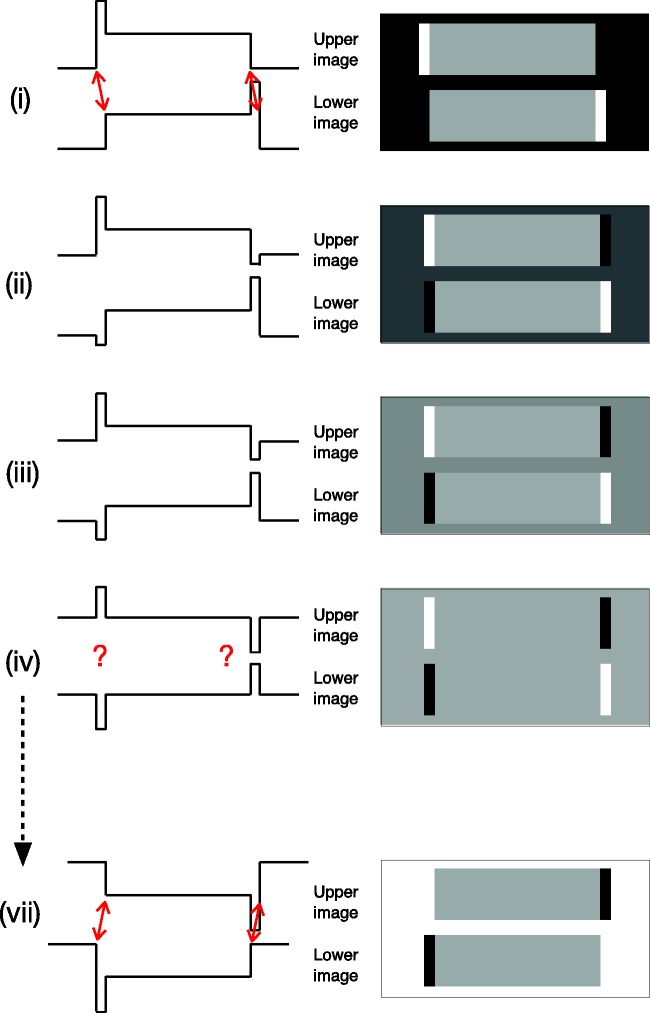
Reversed apparent motion (or reversed phi) can be seen during a continuous dissolve between a positive and a spatially shifted negative version of the same image. Similar reversed effects can be seen in stereo when positive and spatially shifted negative images are presented separately to the two eyes or in a Vernier alignment task when the two images are juxtaposed one above the other. Gregory and Heard reported similar effects that they called "phenomenal phenomena." Here, we investigate the similarities between these different effects and put forward a simple, spatial-smoothing explanation that can account for both the direction and magnitude of the reversed effects in the motion, stereo and Vernier domains. In addition, we consider whether the striking motion effects seen when viewing Kitaoka's colour-dependent Fraser-Wilcox figures are related to the reversed phi illusion, given the similarity of the luminance profiles.

Keywords: Fraser-Wilcox illusion; Vernier alignment; apparent motion; phenomenal phenomena; reversed phi; stereopsis.


Figures

Figure 1.
Figure 1.
Six successive movie frame showing: (a) smooth, real movement; (b) apparent movement, in which the stimulus jumps from a first to a second position; (c) apparent movement dissolve. The black bar is perceived as moving smoothly to the right; (d) reversed phi dissolve from a black bar to a white bar that is displaced to the right. Apparent movement is perceived to the left, opposite to the physical displacement.
Figure 2.
Figure 2.
The wagon-wheel illusion. (a) When a repetitive pattern of light and dark bars is displaced to the left in successive images but with jumps that have a magnitude greater than half a spatial period (green arrow), the nearest neighbouring light (or dark) bar is in the opposite direction, that is, to the right (red arrows). The same thing happens when a repetitive pattern is displaced by a smaller amount to the left but reverses in contrast between each presentation. (b) If a pattern has a luminance profile with different width light and dark bars and it displaces to the left (green arrow), the nearest neighbouring light (or dark) bar in the contrast-reversed image is also in the opposite direction, that is, to the right (red arrows). (c) When the displacement between the pattern and the contrast-reversed version is very small, the nearest neighbouring light (or dark) bar is also to the right (with an amplitude close to half an average spatial period), but there is considerable ambiguity about the direction of displacement (dashed red arrows). (d) If the displacement to the left is increased, the directional ambiguity is reduced.
Figure 3.
Figure 3.
(a) A “reversed phi” sequence of images depicting a continuous dissolve between a light bar on a black background (i) and a contrast-reversed, dark bar shifted slightly to the right (vii). (b) The luminance profiles of the images, and their changes over time, are shown on the right. Note that the widths of the strips are deliberately exaggerated. The reversed phi effect is seen only when the light and dark strips subtend <10 arc min.
Figure 4.
Figure 4.
The results of modelling the first six stages of a reversed phi dissolve between a light bar on a black background and a contrast-reversed, dark bar shifted slightly to the right when the luminance profiles are smoothed by the low-pass Gaussian filter shown in the upper right. (a) When the displacement is small (10 units), the peaks and troughs of the smoothed profile shift progressively to the left. (b) When the displacement is increased (30 units), the peaks and troughs of the smoothed profiles still shift to the left but by a smaller amount. (c) When the displacement is increased farther, (50 units) the peaks and troughs show no shift and the zero-crossings of the major contours all line up at the boundary between the grey surround and the light strip.
Figure 5.
Figure 5.
The spatial-smoothing proposal shows how the size of the shifts of both the peaks (and troughs) and the zero-crossings of the major contours decrease with increasing displacement of the contrast-reversed image. The shifts of the peaks and troughs are double those of the zero crossings. The slope of the zero-crossing function is minus 10/40 = −0.25 and the slope of the peak-shift function is minus 20/40 = −0.5.
Figure 6.
Figure 6.
A demonstration of the reversed stereo effect in which observers should perceive a square wave corrugated surface with alternating horizontal bands of crossed and uncrossed disparities. Image (b) is a composite of the original image (a) plus a displaced negative version of that image. In the uppermost corrugation, the displacement of the negative image in the composite image (b) is to the left but when the image is spatially smoothed, the effective position of the contours is to the right. Hence, with cross-eye fusion, the uppermost band should appear to have a crossed disparity (i.e., lie in front), whereas the second uppermost band should appear to have an uncrossed disparity (i.e., lie behind).
Figure 7.
Figure 7.
(a) The matched amplitude of the reversed depth increases as the balance between the initial (positive) image and the displaced, contrast-reversed negative version presented to the right eye changed from 100:0 to 60:40 percent. (b) The maximum reversed depth was seen with the smallest displacement (1.3 arc min) and fell steadily to zero when the strip width was increased to 6.5 arc min (Rogers & Anstis, 1975). The slope of the best-fitting straight line (dashed) is minus 60″/(60 × 5′) = −0.2.
Figure 8.
Figure 8.
A demonstration of the reversed Vernier offset effect. The upper, left-hand part of the greyscale image shows the first three Stages (1–3) of a dissolve from a light-to-dark edge to a dark-light edge displaced to the right (cf, the right-hand edge of Figure 3). The upper, right-hand part of the image is a mirror-reversed copy. The lower part of the greyscale image shows the three stages of the dissolve back to the original state (3–1). The luminance profiles, deliberately exaggerated in horizontal scale, are shown on the right. The sides of the central rectangle appear to bow outwards in the centre, at the point where the luminance of the surround equals that in the centre (3). This is in the opposite direction to that of the displaced negatives in the composite image. The image should be viewed so that the thin black lines subtend <4 arc min.
Figure 9.
Figure 9.
(a) As the balance between the initial (positive) image and the displaced, contrast-reversed negative version in the lower part of the display changed from 100:0 to 67.5:32.5 percent, the amount of reversed Vernier offset increased (Perrett, 1976). (b) As the magnitude of the displaced negative (corresponding to the strip width) increased, the amount of reversed Vernier offset decreased (Perrett, 1976).
Figure 10.
Figure 10.
A comparison of the greyscale images and their luminance profiles used in a typical “reversed phi” sequence (a) and those used in Gregory and Heard’s “phenomenal phenomena” (b).
Figure 11.
Figure 11.
The results of modelling the low-pass filtering of the luminance profiles used in A&R’s experiments (a) and those used in G&H’s experiments (b) with a strip width of 20 units and Gaussian spatial smoothing of 50 units. The different coloured curves represent the first six stages of a dissolve between the initial image (1 = black line) and the halfway point in the dissolve (6 = dark blue line). Note that both the unsmoothed and smoothed luminance profiles at the halfway point in the dissolve are the same in the two studies.
Figure 12.
Figure 12.
The images (b) and their luminance profiles (a) used in G&H’s reversed stereo experiment. Left-right reversed images were presented to the two eyes. The major contours of the luminance profiles reveal an uncrossed disparity in the first image pair (i) and a crossed disparity in the last image pair (vii). When the opposite contrast images were presented to the two eyes in (iv), no depth was seen. Note that the widths of the strips are deliberately exaggerated. The reversed stereo effect is seen only when the light and dark strips subtend < 6 arc min.
Figure 13.
Figure 13.
(a) The results of modelling the effects of low-pass filtering G&H’s images presented to the two eyes. The zero-crossings (Z/Cs) of the major dark-to-light and light-to-dark contours in the left eye’s image are shifted progressively to the left between Stages 1 (black line) and 6 (dark blue line), creating an increasing uncrossed disparity between the eyes. Likewise, the Z/Cs of the matched dark-to-light and light-to-dark contours in the right eye’s image are shifted progressively to the right between Stages 1 and 6, also creating an increasing uncrossed disparity. (b) G&H’s stereo results showing increasing uncrossed disparity from the iso-dark stripe (1) to the iso-grey rectangle (6).
Figure 14.
Figure 14.
The images (b) and their luminance profiles (a) used in G&H’s Vernier alignment experiment in which the lower image is a left-right reversed version of the upper image. Note that the widths of the strips are deliberately exaggerated—the reversed Vernier effect is seen only when the light and dark strips subtend <4 arc min.
Figure 15.
Figure 15.
Modelling the effects of low-pass filtering on four of the luminance profiles used in G&H’s Vernier alignment study. The green lines show the smoothed luminance profiles in the upper image and the red lines the smoothed luminance profiles in the lower image. The arrows show the relative positions of a peak and a trough for each of the stimuli pairs. In (a), the peak (or trough) in the upper image and the trough (or peak) in the lower image are misaligned, as shown by the black arrows. As the pair of images approach the midpoint, the extent of the misalignment decreases in (b) and (c) until the peak (or trough) in the upper image and the trough (or peak) in the lower image are aligned in (d). (e) G&H’s Vernier alignment results showing a misalignment at the “iso-dark” point (a) that decreases towards alignment at the “iso-grey” point (d).
Figure 16.
Figure 16.
A demonstration of the reversed Vernier offset effect using modified versions of G&H’s stimuli. The sides of the central rectangle appear to bow outwards in centre (Stage 3)—when the luminance of the surround is the same as that of the central rectangle (“iso-grey” in G&H’s terminology), that is, in the opposite direction to that of the displaced negative in the composite image. The effect is evident but less pronounced compared with A&R’s stimuli (Figure 8) but more obvious when viewed slightly peripherally. The display should be viewed so that the thin black lines subtend <4 arc min.

Similar articles

Cited by

References

    1. Anstis S. M. (1970). Phi movement as a subtraction process. Vision Research, 10, 1411–1430. - PubMed
    1. Anstis S. M., Rogers B. J. (1975). Illusory reversal of visual depth and movement during changes of contrast. Vision Research, 15, 957–961. - PubMed
    1. Anstis S. M., & Rogers, B. J., (1986). Illusory continuous motion from oscillating positive-negative patterns: implications for motion perception. Perception, 15, 627–640. - PubMed
    1. Anstis S. M., Smith D. R., Mather G. (2000). Luminance processing in apparent motion, Vernier offset and stereoscopic depth. Vision Research, 40, 657–675. - PubMed
    1. Gregory R. L., Heard P. F. (1983). Visual dissociations of movement, position, and stereo depth: Some phenomenal phenomena. Quarterly Journal of Experimental Psychology, 35A, 217–237. - PubMed

How to cite this article

    1. Rogers B., Anstis S., Ashida H., & Kitaoka A. (2019). Reversed phi and the “phenomenal phenomena” revisited. i-Perception, 10(4), 1–22. doi:10.1177/2041669519856906 - PMC - PubMed

LinkOut - more resources