Review
. 2019 Aug 5;10(1):77.
doi: 10.1186/s13244-019-0768-9.

The Charcot foot: a pictorial review

Affiliations
Review

The Charcot foot: a pictorial review

Andrea B Rosskopf et al. Insights Imaging. .

Abstract

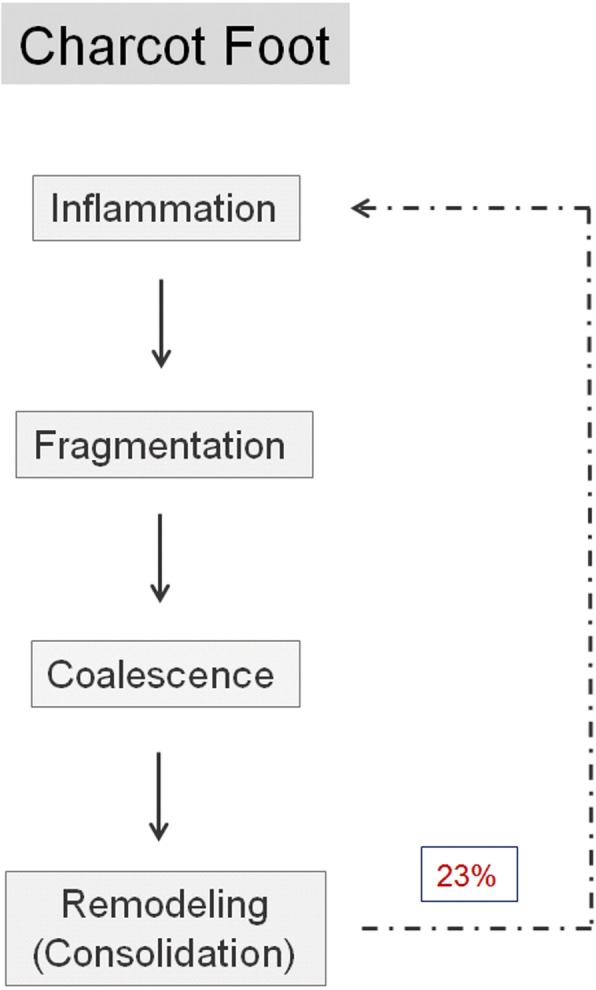
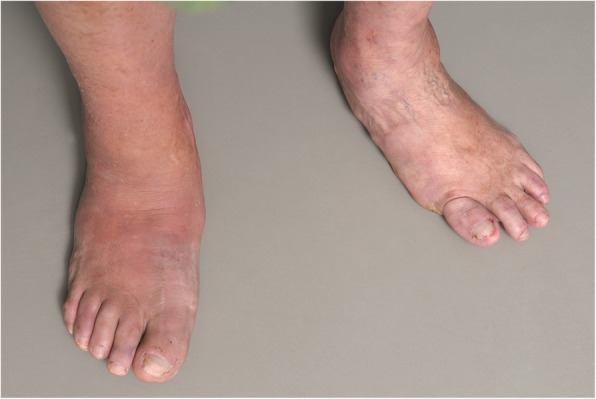
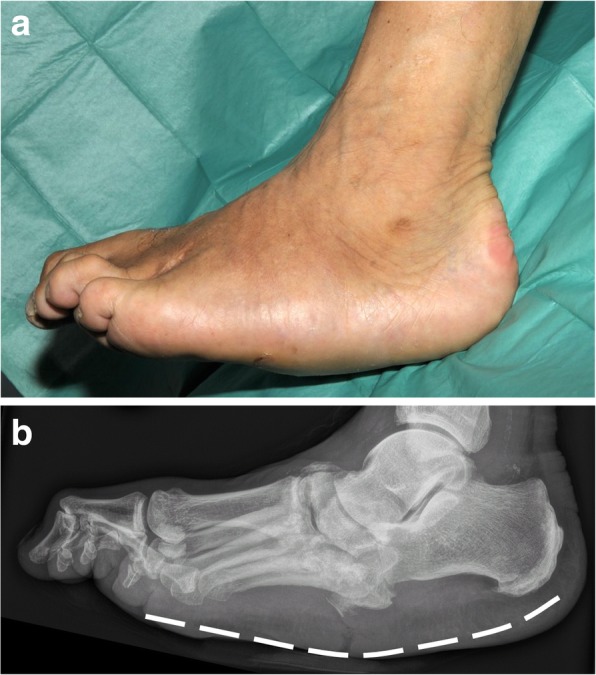
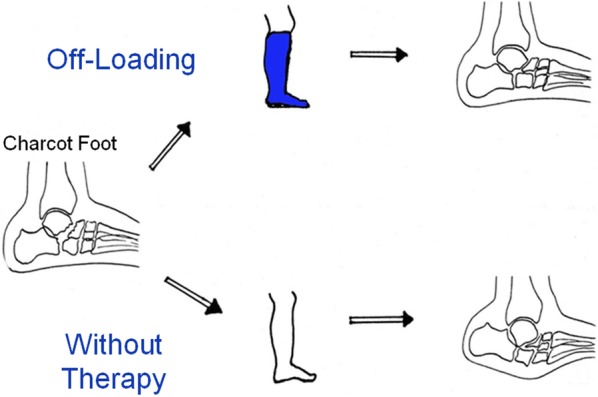
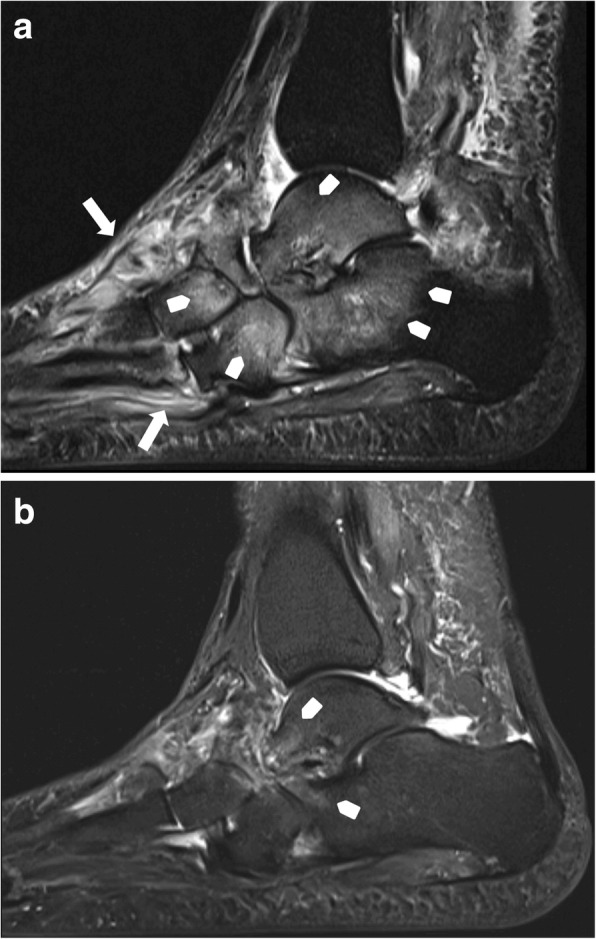
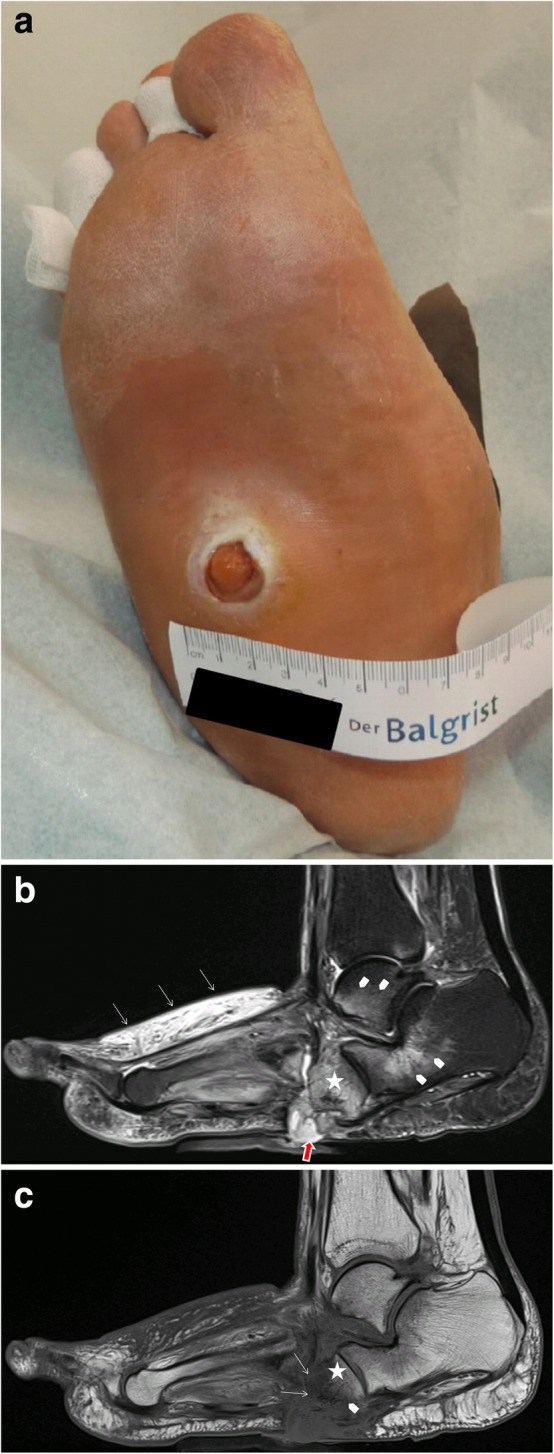
Charcot foot refers to an inflammatory pedal disease based on polyneuropathy; the detailed pathomechanism of the disease is still unclear. Since the most common cause of polyneuropathy in industrialized countries is diabetes mellitus, the prevalence in this risk group is very high, up to 35%. Patients with Charcot foot typically present in their fifties or sixties and most of them have had diabetes mellitus for at least 10 years. If left untreated, the disease leads to massive foot deformation. This review discusses the typical course of Charcot foot disease including radiographic and MR imaging findings for diagnosis, treatment, and detection of complications.

Keywords: Charcot foot; Imaging; MRI; Osteomyelitis; Radiographs.


Conflict of interest statement

The authors declare that they have no competing interests.

Figures

Fig. 1
Fig. 1
Charcot foot: natural course of disease with recurrence rates about 23%, adapted from [–6]
Fig. 2
Fig. 2
A typical Charcot foot in acute active phase: red, hot, and swollen right foot
Fig. 3
Fig. 3
Rocker-bottom deformity: end-stage of Charcot foot. a Clinical image. b Corresponding lateral radiograph
Fig. 4
Fig. 4
Off-loading therapy with total contact casts give the patient the chance of healing properly without debilitating deformities and with a preserved longitudinal arch
Fig. 5
Fig. 5
a Removable total contact cast used for off-loading treatment of active Charcot foot. b Ilizarov fixateur in a patient with Charcot foot
Fig. 6
Fig. 6
Anatomical distribution in the Sanders and Frykberg classification. Zone I: metatarsophalangeal and interphalangeal joints, zone II: tarsometatarsal joints, zone III: tarsal joints, zone IV: ankle and subtalar joints, and zone V: calcaneus
Fig. 7
Fig. 7
Radiographs of the right foot in dp (a) and lateral projection (b) involving zone II. Note the involvement of the tarsometatarsal articulations (white arrows) with lateral subluxation of the metatarsal bones in the Lisfranc’s joint
Fig. 8
Fig. 8
Lateral radiograph of the left foot in a patient with Charcot foot involving zone III according to Sanders and Frykberg classification (tarsal joints). The white arrow points at the typical inferior luxation of the talar head; the red arrow points at the cuboid, typically becoming the most inferior bone of the foot
Fig. 9
Fig. 9
Weight-bearing radiograph in dp projection (a baseline, b 5 months later). Notice the development of fractures and subchondral cysts, erosions, joint distention, and luxation of the Lisfranc’s joint (white arrows)
Fig. 10
Fig. 10
Lateral weight-bearing radiographs showing the typical course of Charcot foot disease over time (a baseline, b 10 months later). Note the continuous increase of Meary’s angle (black angle), the diminution of cuboid height, which is becoming negative (yellow distance) and the decrease of the calcaneal pitch (white angle) [19]
Fig. 11
Fig. 11
Radiograph in dp projection showing the changes in foot morphology in a typical Charcot foot patient over time (a baseline, b 10 months later). Note the increase in forefoot abduction relative to the hindfoot: The hindfoot-forefoot angle (yellow curve) is the angle between the longitudinal axis of the 2nd metatarsal bone (yellow line) and the bisection (black dotted line) of another angle (white curve), which is formed by the following two lines: the midline through the talar neck and head and a line parallel to the lateral cortex of the calcaneus (white arrows) [19]
Fig. 12
Fig. 12
Use of MRI for diabetic patients with neuropathy in the setting of Charcot foot. Three main MRI-benefits: confirmation of diagnosis in early Charcot, monitoring of disease activity, and imaging of complications (infection/osteomyelitis)
Fig. 13
Fig. 13
Proposed MRI-protocol for evaluation of the Charcot foot with four sequences: sagittal STIR, 3 mm, whole foot (a); sagittal T1, 3 mm, whole foot (b); transverse T1, 3 mm, hindfoot including Lisfranc’s joints (c); coronal T2, 3 mm, hindfoot including Lisfranc’s joints (d). Additional contrast media application is optional for patients with suspected infection/osteomyelitis: sagittal T1 fs 3 mm post contrast and axial T1 fs 3 mm post contrast. Note: Of course, the protocol should be extended and adapted in cases of non-Charcot-related complications, that require better spatial resolutions: e.g., additional sequences with smaller field of view, when infection at the distal toes in a diabetic foot is suspected
Fig. 14
Fig. 14
Imaging of early active Charcot foot. a Lateral weight-bearing radiograph showing no abnormalities. b Sagittal STIR-Sequence in MRI showing classic bone marrow edema in the midfoot (black asterisks) and the soft tissue and muscle edema (white arrows) in the midfoot
Fig. 15
Fig. 15
Active Charcot foot (stage of fragmentation). a Sagittal STIR: note the superior dislocation of the metatarsals at the level of Lisfranc’s joint (white arrow heads); massive bone marrow edema (black asterisks) in metatarsal bone, navicular bone, and cuneiform bones; and massive soft tissue edema (white thin arrows). b Sagittal T1: shows degree of bone destruction and fragmentation in the midfoot with huge signal drop (arrows) in the fatty bone marrow, similar to signal drops in osteomyelitis (white arrows)
Fig. 16
Fig. 16
Active middle-stage disease (fragmentation) of Charcot foot demonstrating gross cortical fractures of the second to fifth metatarsal bone (white arrows) (a coronal STIR image of the forefoot, b corresponding oblique radiograph)
Fig. 17
Fig. 17
Three sagittal images of different patients showing classic features of late-stage Charcot foot. a (Sagittal STIR) inferior dislocation of the talar head (white arrow), effusion in the tibiotalar joint (white arrow head). b (Sagittal STIR) prominent subchondral cysts at the Lisfranc’s joint (white arrows). c (Sagittal T1) bone proliferation and debris in the midfoot (white arrows) and fragmentation of navicular bone
Fig. 18
Fig. 18
A 45-year old patient with Charcot foot and sudden shortening of the leg due to a collapse in Sanders/Frykberg zone IV (a). Note the huge amount of fluid (black asterisk) and debris within the impacted zone of the hindfoot (white arrows) on sagittal STIR-image (b). Corresponding coronal CT slice in standing position (d) shows medial dislocation of the hindfoot (red arrow) under weight-bearing (d) compared to non-weight-bearing CT (c). The white asterisk marks the calcaneus
Fig. 19
Fig. 19
Before off-loading therapy (a sagittal STIR, b sagittal T1): active stage of Charcot disease with a significant amount of bone marrow edema (white arrow heads) and soft tissue edema (white arrows) (a). Also note the subluxation at the Chopard’s joint with downward tilt of the talar head (b) 7 months after a consequent off-loading therapy with a total contact cast: note the almost complete disappearance of bone marrow edema (white arrow heads) and soft tissue edema on sagittal STIR sequence
Fig. 20
Fig. 20
Patient with ulceration (a) at the sole of the foot directly beneath the cuboid bone as a typical complication of rocker-bottom deformity of the foot. MRI with sagittal STIR sequence (b) demonstrates contiguous spread of infection from the skin, forming a sinus tract (red arrow) to the cuboid bone (asterisk) and bone marrow edema due to active Charcot disease (arrow heads). Sagittal T1-weighted sequence shows focal replacement of fatty bone marrow signal within the cuboid bone (c), representing osteomyelitis
Fig. 21
Fig. 21
MRI of a Charcot foot complicated with osteomyelitis. a Sagittal T1. b Sagittal STIR. c Sagittal T1 fat sat after contrast administration. Skin ulceration and sinus tract extending from the skin to the talar bone are present, showing a direct spread of infection (red arrow) (a). Diffuse bone marrow alteration is present within the talus. Note the disappearance of bony contours in the sagittal T1-weighted image (white arrows in b) and the reappearance of the bone structures after contrast administration (white arrows in c) demonstrating the “Ghost sign,” which is described in many reviews as pathognomonic for osteomyelitis in Charcot foot [20]. However, up to now, there is no study published evaluating the accuracy of this sign

References

    1. La Fontaine J, Lavery L, Jude E. Current concepts of Charcot foot in diabetic patients. Foot (Edinb) 2016;26:7–14. doi: 10.1016/j.foot.2015.11.001. - DOI - PubMed
    1. Ergen FB, Sanverdi SE, Oznur A (2013) Charcot foot in diabetes and an update on imaging. Diabetic Foot & Ankle 4:21884 - PMC - PubMed
    1. Schoots IG, Slim FJ, Busch-Westbroek TE, Maas M. Neuro-osteoarthropathy of the foot-radiologist: friend or foe? Semin Musculoskelet Radiol. 2010;14:365–376. doi: 10.1055/s-0030-1254525. - DOI - PubMed
    1. Osterhoff G, Boni T, Berli M. Recurrence of acute Charcot neuropathic osteoarthropathy after conservative treatment. Foot Ankle Int. 2013;34:359–364. doi: 10.1177/1071100712464957. - DOI - PubMed
    1. Eichenholtz SN (1966) Charcot Joints. Charles C Thomas, Springfield, III, pp. 3–10