. 2019 Oct;30(10):2041-2050.
doi: 10.1007/s13361-019-02265-9. Epub 2019 Aug 5.

MALDI-Mass Spectrometry Imaging to Investigate Lipid and Bile Acid Modifications Caused by Lentil Extract Used as a Potential Hypocholesterolemic Treatment

Affiliations

MALDI-Mass Spectrometry Imaging to Investigate Lipid and Bile Acid Modifications Caused by Lentil Extract Used as a Potential Hypocholesterolemic Treatment

Michele Genangeli et al. J Am Soc Mass Spectrom. 2019 Oct.

Abstract

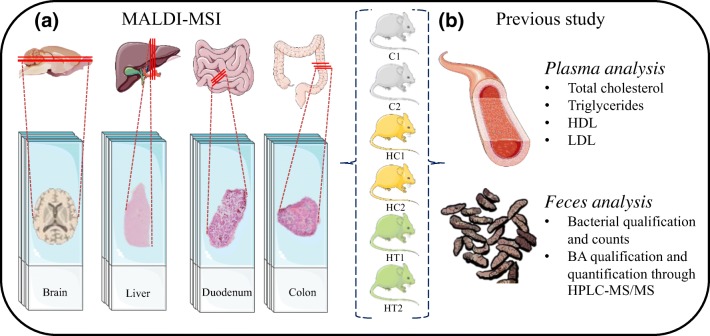
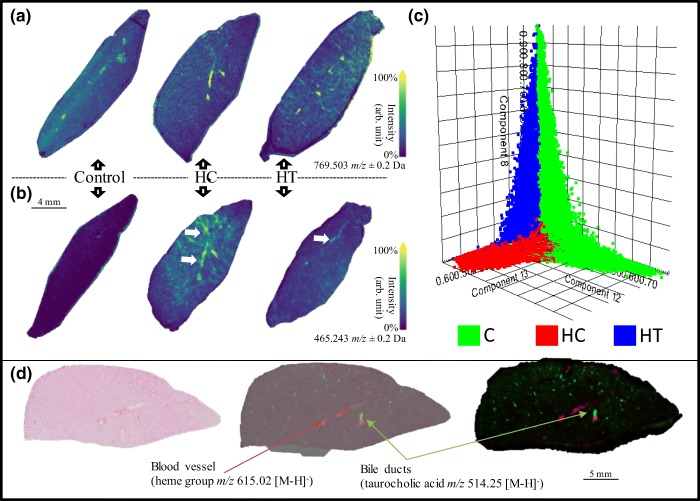
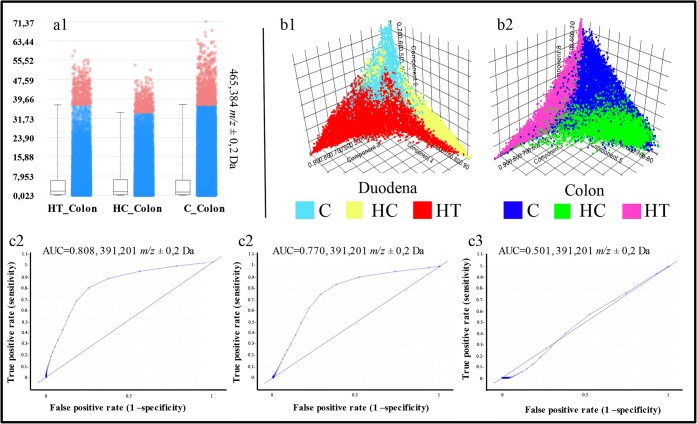
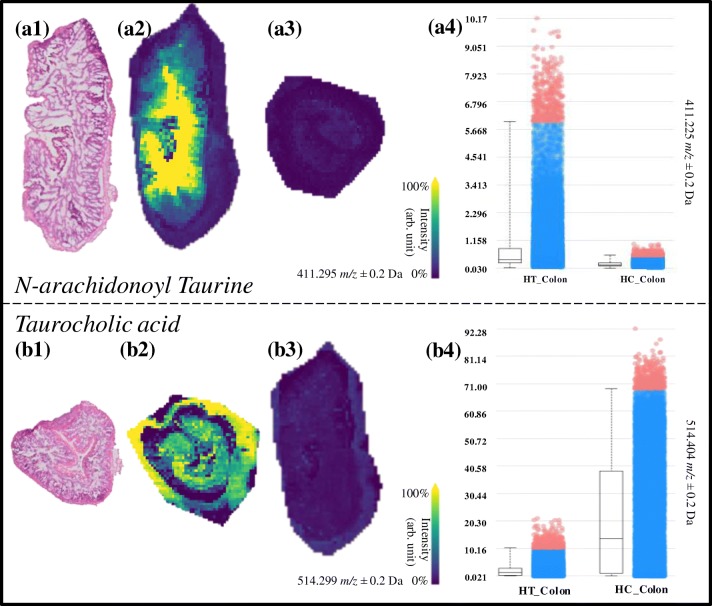
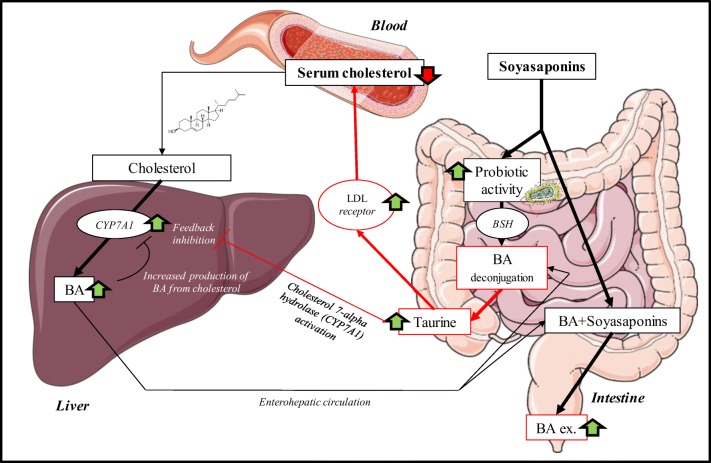
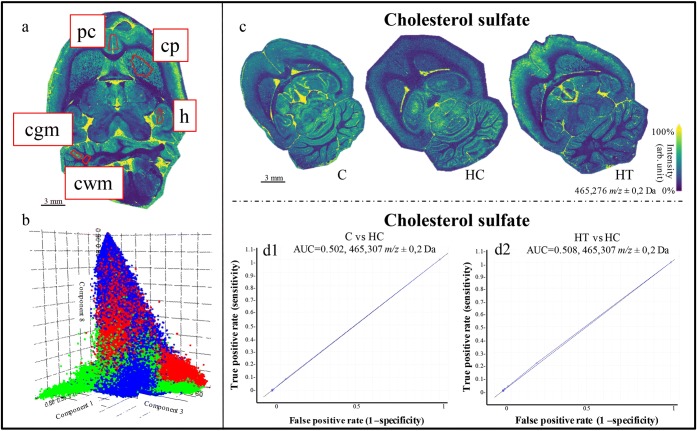
This paper reports matrix-assisted laser desorption/ionization mass spectrometry imaging to investigate systematic effects of a lentil extract treatment to lower cholesterol levels. For this purpose, mass spectrometry imaging was used to spatially investigate modifications in the lipid composition and cholesterol levels in the brain, liver, and intestines as well as bile acids in the liver and intestine of rats treated with lentil extract. Neither the lipid composition nor cholesterol levels in the brain samples were found to be significantly different between the treated and not-treated animal groups. The hypercholesterolemic livers showed signs of steatosis (lipid marker PG 36:4), but no modifications in bile acid, cholesterol, and lipid composition. We found significant differences (AUC > 0.75) in the intestines regarding bile acid and lipid composition after treatment with the lentil extract. The treated rats showed a decreased reabsorption (increased excretion) of ursodeoxycholic acid, deoxycholic acid, and chenodeoxycholic acid and an increased deconjugation of taurine-conjugated bile acids (taurochenodeoxycholic acid, taurodeoxycholic acid, taurocholic acid, and 3-keto-taurocholic acid). This indicates that the lentil extract lowers the total cholesterol level in two synergic ways: (i) it increases the excretion of bile acids; hence, new bile acids are produced in the liver from serum cholesterol and (ii) the prebiotic effect leads to free taurine which upregulates the de novo synthesis of bile acid from cholesterol while activating LDL receptors. We demonstrate here that mass spectrometry imaging is a valuable tool for a better understanding of the effects of treatments such as for the synergistic cholesterol-lowering effect of the lentil extract.

Keywords: Imaging mass spectrometry; LCMS; Lentils; Lipids; MALDI-MSI; Neutraceutics.


Figures

Figure 1
Figure 1
(a) Experimental design. A total of six rats (2× control [C], 2× hypercholesterolemic control [HC], and 2× hypercholesterolemic treated [HT]) were sacrificed. Four organs were collected from each rat (brain, liver, duodenum, and colon), sliced, and analyzed in triplicate. (b) The animals included in this paper are the same rats used for the paper from Micioni Di Bonaventura et al., where the listed analyses were performed. The images are meant for illustrative and explanatory purposes only. Images of the brain was created by Gill Brown [41]; other images were taken from SERVIER medical Art (CC) [https://smart.servier.com/]
Figure 2
Figure 2
(a) Molecular distribution of the cholesterol sulfate. From the image, it is clear that there are no differences in regard to cholesterol expression in the three liver groups. (b) Molecular image of the mass peak corresponding to PG 36:4 (a marker for steatosis, as indicated by the white arrows). Results show that the signal measured for PG is relatively higher in the HC liver compared with that of the treated group and control. (c) Unsupervised statistical analysis (pLSA) showing a clear distribution of the three groups (green, control; red, hypercholesterolemic control; and blue, hypercholesterolemic treated). (d) Blood vessels and bile ducts highlighted using the heme group (m/z 615.02 [M-H]) and the taurocholic acid (m/z 514.25 [M-H]), respectively
Figure 3
Figure 3
(a) Cholesterol level in the three colon groups. No significant variations are shown. (b1, b2) Score plot from the pLSA between the three duodena groups (b1, C, light blue; HC, yellow; HT, red) and between the three colon groups (b2, C, blue; HC, green; HT, pink). Both the pLSA show differences between the groups, especially in the colon. (c1–c3) ROC plots for peak m/z 391.2 (CDCA/DCA/UDCA) which show significant differences in the expression of these BA in the (c1) HT_Colon vs C_Colon and (c2) HT_Colon vs HC_Colon and no differences in the (c3) HT_Duodenum vs HC_Duodenum
Figure 4
Figure 4
(a1–a4) Molecular images of N-arachidonoyl taurine in the HT_Colon (a2) and HC_Colon (a3). (a4) Boxplot of the intensity of N-arachidonoyl taurine in the HT_Colon vs. the HC_Colon. (b1–b4) Molecular images of taurocholic acid in the HC_Colon (b2) and HT_Colon (b3). (b4) Boxplot of the intensity of N-arachidonoyl taurine in the HT_Colon vs. the HC_Colon
Figure 5
Figure 5
Overview of the duplex cholesterol-lowering mechanisms of soyasaponins by increasing the excretion of BA with the faces, which stimulates the production of new BA from cholesterol. Increased probiotic activity which results in an increased release of free taurine. Taurine both increases the activity of the cholesterol 7-alpha hydrolase enzyme in the liver (CYP7A1) and stimulates LDL receptors in the body, resulting in an overall reduction of serum cholesterol. The images are meant for illustrative and explanatory purposes only. Images were taken from SERVIER medical Art (CC) [23]
Figure 6
Figure 6
(a) Molecular images of the brain highlighted in red; the regions of interest (ROIs) delineated for the analysis: prelimbic cortex (pc), caudate putamen (cp), hippocampus (h), white (cwm) and gray (cgm) matter in the cerebellum. (b) 3D loading plot for the pLSA of the whole brains of the three groups. Blue represents the control group (C), green the hypercholesterolemic control (HC), and red the hypercholesterolemic treated group (HT). Results display no separation among the different groups. (c) Molecular images based on the distribution of cholesterol sulfate (m/z 465.3) over the whole brain for the C, HC, and HT groups. (d1, d2) ROC plots of the m/z 465.3 (cholesterol sulfate) from the comparison between (d1) C and HC, and between (d2) HT and HC

Similar articles

Cited by

References

    1. Jimenez-Chillaron JC, Diaz R, Martinez D, Pentinat T, Ramon-Krauel M, Ribo S, Plosch T. The role of nutrition on epigenetic modifications and their implications on health. Biochimie. 2012;94:2242–2263. - PubMed
    1. Kilonzo-Nthenge, A.K, S.N Nahasnon..: Soybean in monogastric nutrition: modifications to add value and disease prevention properties. (2013)
    1. Ganesan K, Xu B. Polyphenol-rich lentils and their health promoting effects. Int. J. Mol. Sci. 2017;18:2390. - PMC - PubMed
    1. Johnson CR, Thavarajah D, Combs GF, Thavarajah P. Lentil (Lens culinaris L.): a prebiotic-rich whole food legume. Food Res. Int. 2013;51:107–113.
    1. Micioni Di Bonaventura, M.V., Cecchini, C., Vila-Donat, P., Caprioli, G., Cifani, C., Coman, M.M., Cresci, A., Fiorini, D., Ricciutelli, M., Silvi, S., Vittori, S., Sagratini, G.: Evaluation of the hypocholesterolemic effect and prebiotic activity of a lentil (Lens culinaris Medik) extract. Mol. Nutr. Food Res. 61, (2017) - PubMed

MeSH terms