. 2019 Oct;13(10):2227-2245.
doi: 10.1002/1878-0261.12557. Epub 2019 Aug 18.

Integrative analysis of gene expression and DNA methylation through one-class logistic regression machine learning identifies stemness features in medulloblastoma

Affiliations

Integrative analysis of gene expression and DNA methylation through one-class logistic regression machine learning identifies stemness features in medulloblastoma

Hao Lian et al. Mol Oncol. 2019 Oct.

Abstract

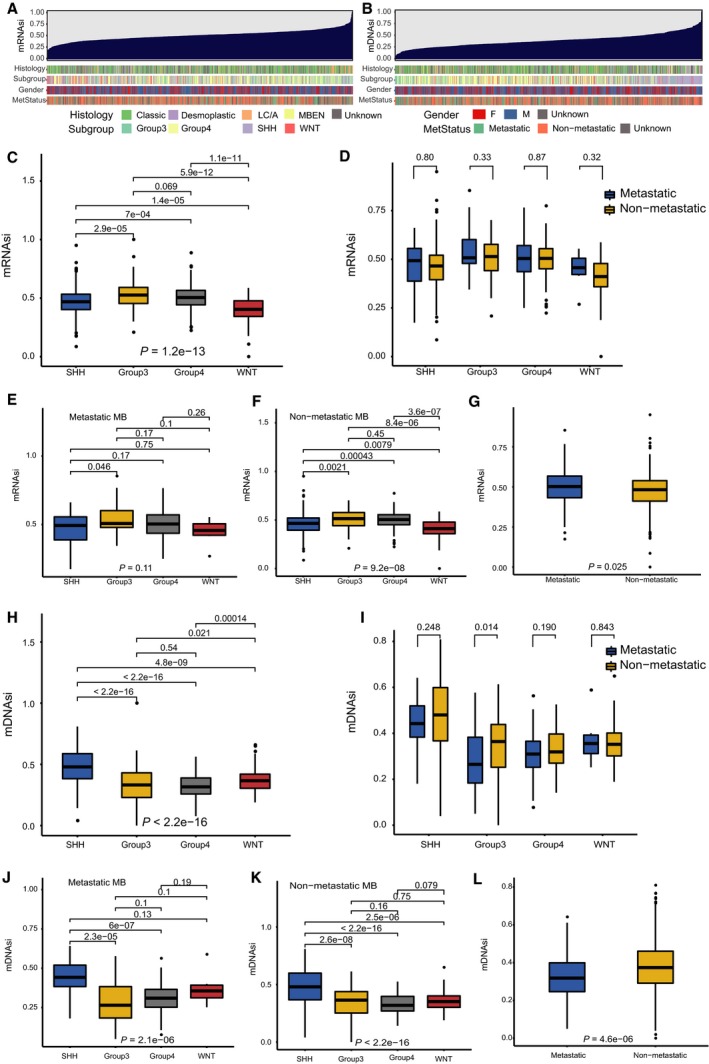
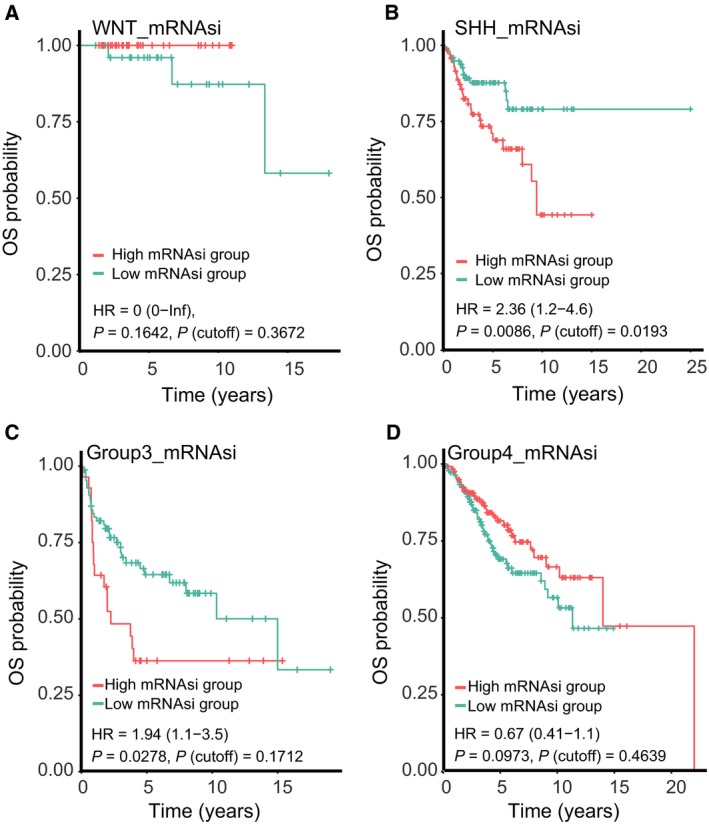
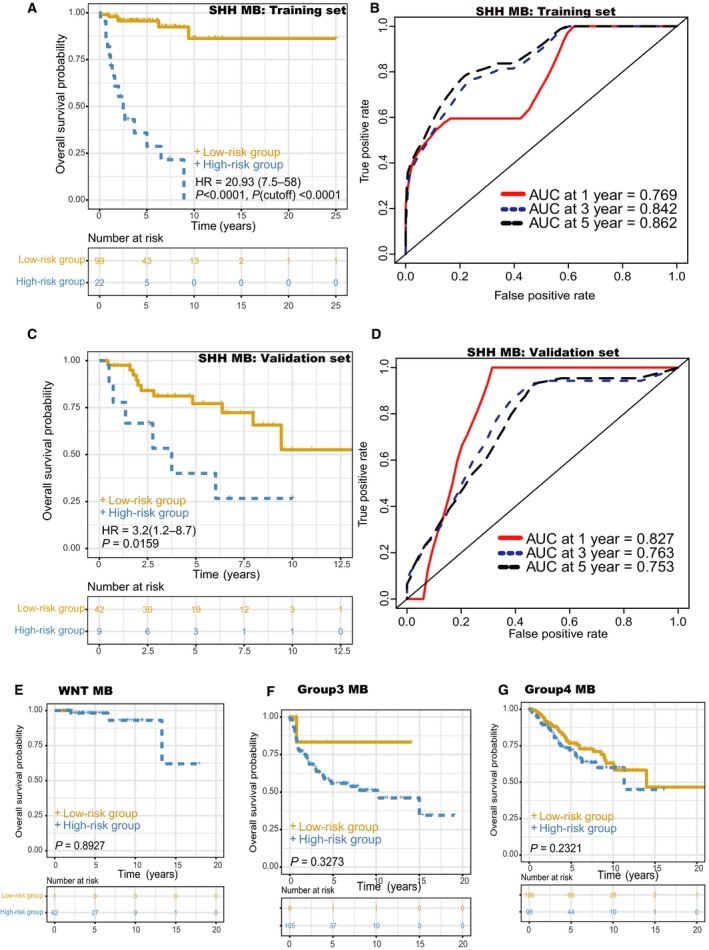
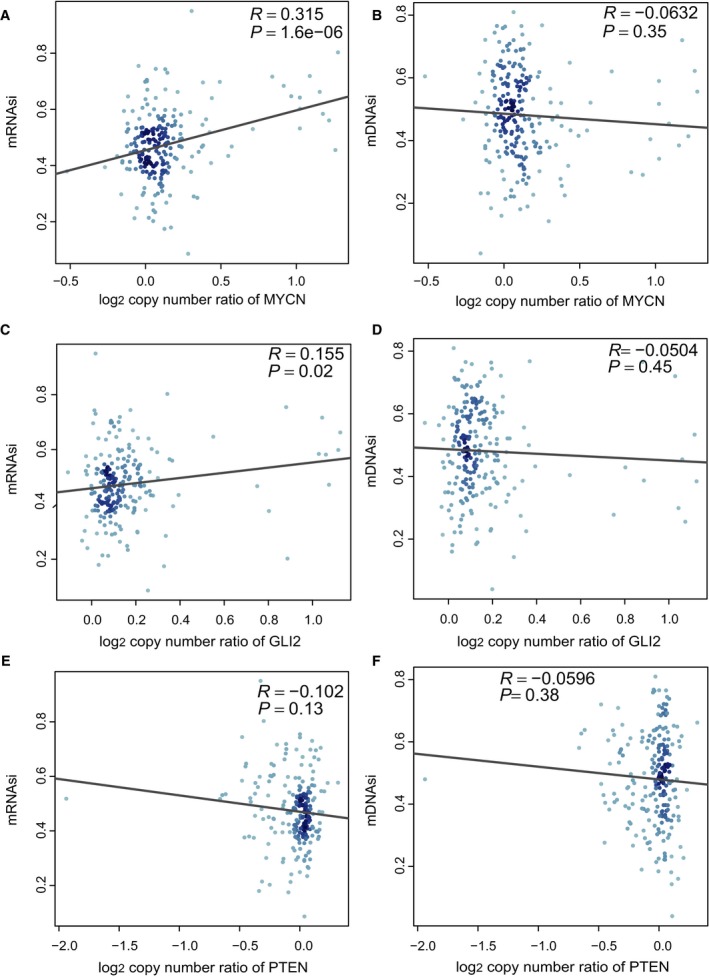
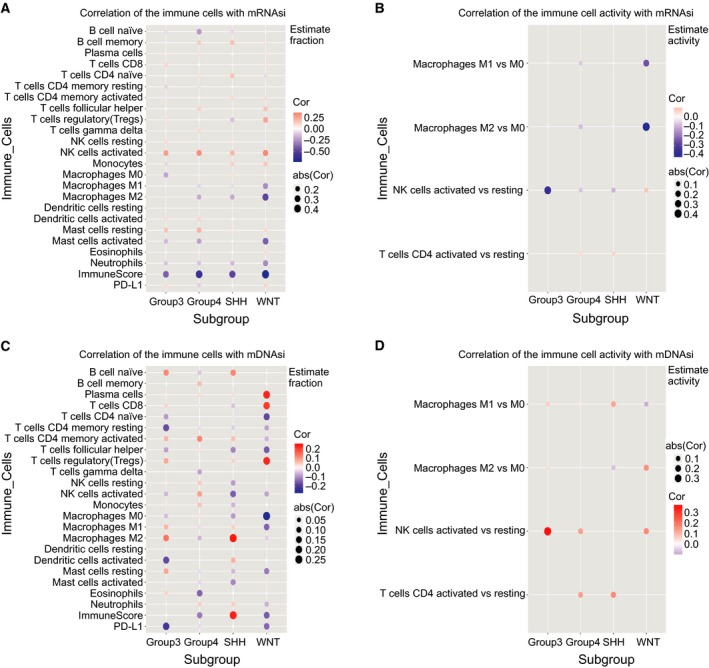
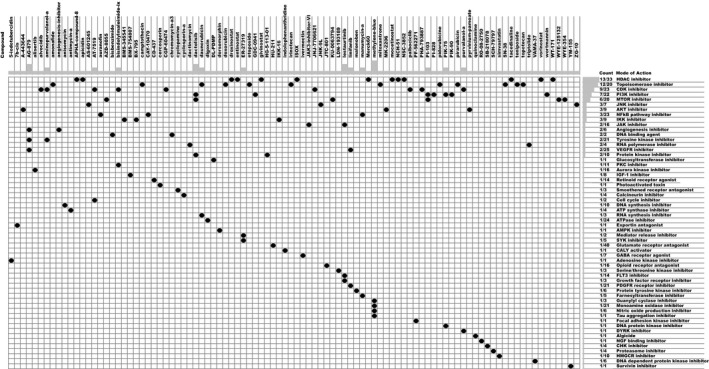
Most human cancers develop from stem and progenitor cell populations through the sequential accumulation of various genetic and epigenetic alterations. Cancer stem cells have been identified from medulloblastoma (MB), but a comprehensive understanding of MB stemness, including the interactions between the tumor immune microenvironment and MB stemness, is lacking. Here, we employed a trained stemness index model based on an existent one-class logistic regression (OCLR) machine-learning method to score MB samples; we then obtained two stemness indices, a gene expression-based stemness index (mRNAsi) and a DNA methylation-based stemness index (mDNAsi), to perform an integrated analysis of MB stemness in a cohort of primary cancer samples (n = 763). We observed an inverse trend between mRNAsi and mDNAsi for MB subgroup and metastatic status. By applying the univariable Cox regression analysis, we found that mRNAsi significantly correlated with overall survival (OS) for all MB patients, whereas mDNAsi had no significant association with OS for all MB patients. In addition, by combining the Lasso-penalized Cox regression machine-learning approach with univariate and multivariate Cox regression analyses, we identified a stemness-related gene expression signature that accurately predicted survival in patients with Sonic hedgehog (SHH) MB. Furthermore, positive correlations between mRNAsi and prognostic copy number aberrations in SHH MB, including MYCN amplifications and GLI2 amplifications, were detected. Analyses of the immune microenvironment revealed unanticipated correlations of MB stemness with infiltrating immune cells. Lastly, using the Connectivity Map, we identified potential drugs targeting the MB stemness signature. Our findings based on stemness indices might advance the development of objective diagnostic tools for quantitating MB stemness and lead to novel biomarkers that predict the survival of patients with MB or the efficacy of strategies targeting MB stem cells.

Keywords: connectivity map; machine-learning methods; medulloblastoma; prognostic model; stemness; tumor immune environment.


Conflict of interest statement

The authors declare no conflict of interest.

Figures

Figure 1
Figure 1
Clinical and molecular features associated with the mRNA expression‐based stemness index (mRNAsi) and the mDNAsi in MB. (A) An overview of the association between known clinical and molecular features (histology, subgroup, gender, and metastatic status) and mRNAsi in MB. Columns represent samples sorted by mRNAsi from low to high (top row). Rows represent known clinical and molecular features. (B) An overview of the association between known clinical and molecular features (histology, subgroup, gender, and metastatic status) and mDNAsi in MB. Columns represent samples sorted by mDNAsi from low to high (top row). Rows represent known clinical and molecular features. (C) Boxplots of mRNAsi in individual samples stratified by subgroup. (D) Boxplots of mRNAsi in individual samples from each MB subgroup, stratified by metastatic status. (E) Boxplots of mRNAsi in individual samples of patients with metastatic MB, stratified by subgroup. (F) Boxplots of mRNAsi in individual samples of patients with nonmetastatic MB, stratified by subgroup. (G) Boxplots of mRNAsi in individual samples stratified by metastatic status. (H) Boxplots of mDNAsi in individual samples stratified by subgroup. (I) Boxplots of mDNAsi in individual samples from each MB subgroup, stratified by metastatic status. (J) Boxplots of mDNAsi in individual samples of patients with metastatic MB, stratified by subgroup. (K) Boxplots of mDNAsi in individual samples of patients with nonmetastatic MB, stratified by subgroup. (L) Boxplots of mDNAsi in individual samples stratified by metastatic status. L/CA, large cell/anaplastic; MBEN, medulloblastoma with extensive nodularity; F, female; M, male; MetStatus, metastatic status.
Figure 2
Figure 2
K‐M curves showing the OS of each subgroup of MB patients with high or low mRNAsi. The K‐M survival curves show the OS based on the high and low mRNAsi patients divided by the optimal cutoff point. (A) K‐M curve showing the OS of WNT MB patients with a high or low mRNAsi. (B) K‐M curve showing the OS of SHH MB patients with a high or low mRNAsi. (C) K‐M curve showing the OS of group 3 MB patients with a high or low mRNAsi. (D) K‐M curve showing the OS of group 4 MB patients with a high or low mRNAsi.
Figure 3
Figure 3
Prognostic value of the 23‐mRNA‐based prognostic model in patients stratified by MB subgroup. The K‐M survival curves show the OS based on the high‐ and low‐risk groups divided by the optimal cutoff point. (A) K‐M curves for the training set of SHH MB patients. (B) Time‐dependent ROC curves showed the predictive efficiency of the 23‐mRNA‐based prognostic model in the training set of SHH MB patients. (C) K‐M curves for the validation set of SHH MB patients. (D) Time‐dependent ROC curves showed the predictive efficacy of the 23‐mRNA‐based prognostic model in the validation set of SHH MB patients. (E) K‐M curves for the WNT MB patients. (F) K‐M curves for the group 3 MB patients. (G) K‐M curves for the group 4 MB patients.
Figure 4
Figure 4
Associations of stemness indices with the prognostic copy number alterations in SHH MB. (A) Correlation between mRNAsi and MYCN amplification. (B) Correlation between mDNAsi and MYCN amplification. (C) Correlation between mRNAsi and GLI2 amplification. (D) Correlation between mDNAsi and GLI2 amplification. (E) Correlation between mRNAsi and PTEN deletion. (F) Correlation between mDNAsi and PTEN deletion.
Figure 5
Figure 5
Associations of stemness indices with the immune microenvironment in each subgroup of MB. (A) Plots show correlations between the mRNAsi and CIBERSORT estimates of immune cell subpopulation fractions and PD‐L1 protein expression. (B) Plots show correlations between the mRNAsi and estimated immune cell activity, computed as the difference between the fractions of activated and resting populations. The correlations are included for macrophages, NK cells, and CD4+ T cells. (C) Plots show correlations between the mDNAsi and CIBERSORT estimates of immune cell subpopulation fractions and PD‐L1 protein expression. (D) Similar to (B), plots show correlations between mDNAsi and estimated immune cell activity.
Figure 6
Figure 6
Heatmap showing each compound (perturbagen) from the CMap that shares a MoA (rows), sorted by descending number of compounds with a shared MoA. The above compounds have an enrichment score ≤ −95 and might be capable of targeting the MB stemness signature.

References

    1. Angeletti F, Fossati G, Pattarozzi A, Würth R, Solari A, Daga A, Masiello I, Barbieri F, Florio T and Comincini S (2016) Inhibition of the autophagy pathway synergistically potentiates the cytotoxic activity of givinostat (ITF2357) on human glioblastoma cancer stem cells. Front Mol Neurosci 9, 107. - PMC - PubMed
    1. Aoki T, Hino M, Koh K, Kyushiki M, Kishimoto H, Arakawa Y, Hanada R, Kawashima H, Kurihara J, Shimojo N et al (2016) Low frequency of programmed death ligand 1 expression in pediatric cancers. Pediatr Blood Cancer 63, 1461–1464. - PMC - PubMed
    1. Batsaikhan BE, Yoshikawa K, Kurita N, Iwata T, Takasu C, Kashihara H and Shimada M (2014) Cyclopamine decreased the expression of Sonic Hedgehog and its downstream genes in colon cancer stem cells. Anticancer Res 34, 6339–6344. - PubMed
    1. Battula VL, Nguyen K, Sun J, Pitner MK, Yuan B, Bartholomeusz C, Hail N and Andreeff M (2017) IKK inhibition by BMS‐345541 suppresses breast tumorigenesis and metastases by targeting GD2 + cancer stem cells. Oncotarget 8, 36936–36949. - PMC - PubMed
    1. Bjerkvig R, Tysnes BB, Aboody KS, Najbauer J and Terzis AJ (2005) Opinion: the origin of the cancer stem cell: current controversies and new insights. Nat Rev Cancer 5, 899–904. - PubMed

Publication types

LinkOut - more resources