Review
. 2019 Aug;24(8):1-11.
doi: 10.1117/1.JBO.24.8.080901.

Clinical applications of laser speckle contrast imaging: a review

Affiliations
Review

Clinical applications of laser speckle contrast imaging: a review

Wido Heeman et al. J Biomed Opt. 2019 Aug.

Abstract

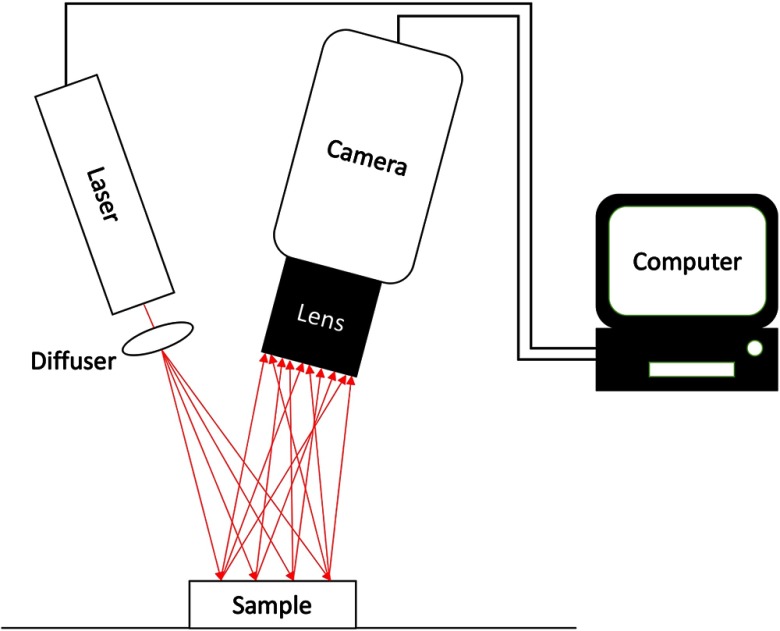
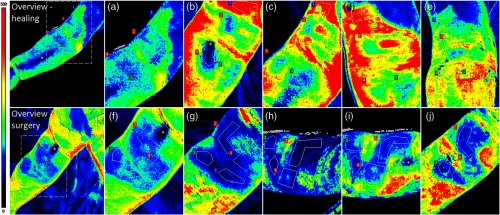
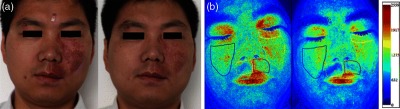
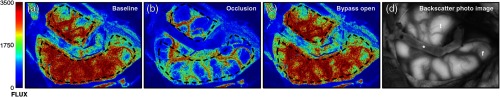
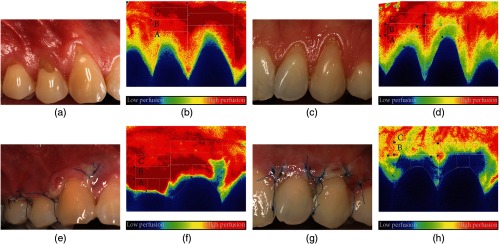
When a biological tissue is illuminated with coherent light, an interference pattern will be formed at the detector, the so-called speckle pattern. Laser speckle contrast imaging (LSCI) is a technique based on the dynamic change in this backscattered light as a result of interaction with red blood cells. It can be used to visualize perfusion in various tissues and, even though this technique has been extensively described in the literature, the actual clinical implementation lags behind. We provide an overview of LSCI as a tool to image tissue perfusion. We present a brief introduction to the theory, review clinical studies from various medical fields, and discuss current limitations impeding clinical acceptance.

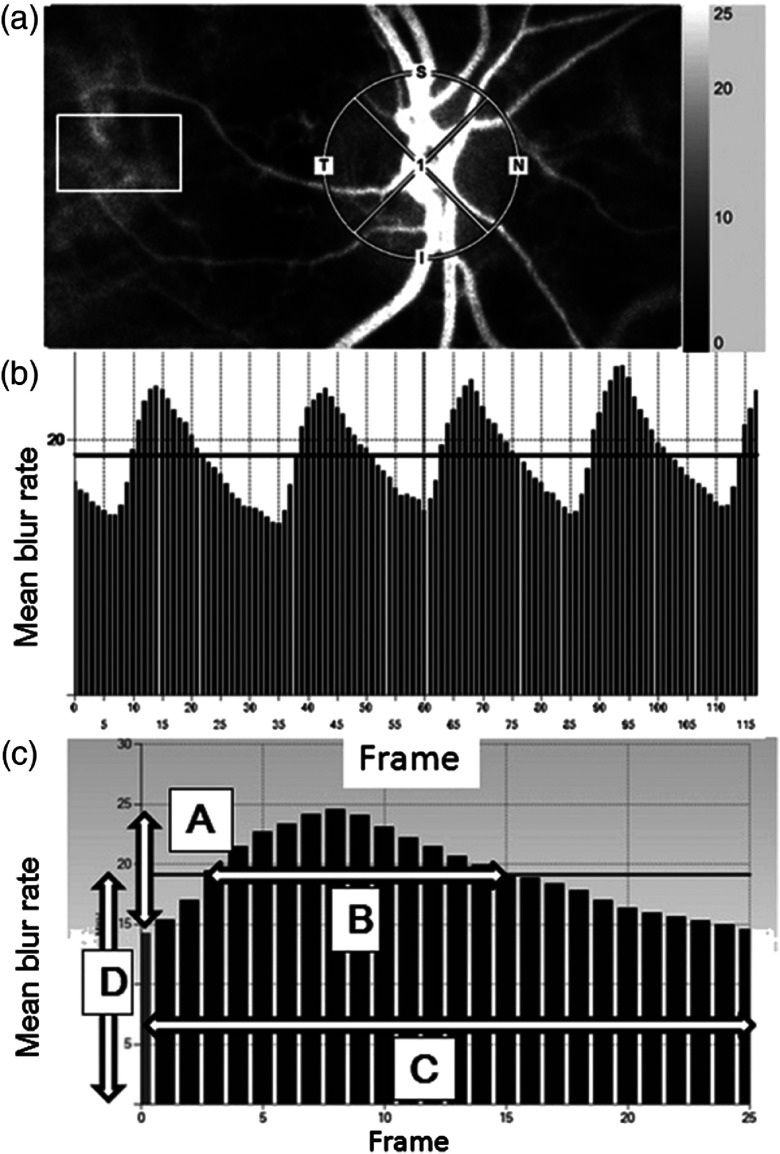
Keywords: burn wounds; cerebral blood flow; laser speckle contrast imaging; microcirculation; retinal perfusion.


Figures

Fig. 1
Fig. 1
A typical LSCI setup with a laser, diffuser, camera, and processing software.
Fig. 2
Fig. 2
A pixel matrix where the orange pixels are used to calculate the contrast for the yellow pixel. In the top right corner, a graphical representation of temporal contrast calculated over 15 frames. In the bottom left corner, a representation of spatial contrast assuming a 3×3 window. In the top left corner, a representation of spatio-temporal contrast calculated over 15 frames.
Fig. 3
Fig. 3
A graph displaying the relation between the speckle contrast and the speckle decorrelation time τc over the integration time T for the Lorentzian (right) and Gaussian (left) velocity distributions.
Fig. 4
Fig. 4
LASCA image of right hands and related NVC pictures in (a) a healthy subject, and in SSC patients with (b) “early, (c) “active”, or (d) “late” pattern of microangiopathy (NVC picture magnification 200×). Figure reprinted from Fig. 1 in Ref. , © 2019, with permission from BMJ.
Fig. 5
Fig. 5
Examples of perfusion in scalds with various healing times in two different children. On the upper row, a wound on the right upper and lower arm is shown that contains regions that healed between 9 and 17 days. Perfusion images (a)–(e) are acquired at (a) 14 h, (b) 4 days, (c) 6 days, (d) 8 days, and (e) 15 days after the injury. On the lower row, a wound on the upper arm of another patient is shown, which contains different regions that did not heal after 14 days and subsequently underwent surgery. Perfusion images (f)–(j) are acquired at (f) 5 h, (g) 3 days, (h) 6 days, (i) 8 days, and (j) 10 days after the injury. The asterisks (*) indicates area with erroneously low perfusion values due to specular reflections. The color bar on the left side indicates the perfusion scale (0 to 500 PU). Figure reprinted from Fig. 3 in Ref. , © 2019, with permission from Elsevier.
Fig. 6
Fig. 6
Representative data of a 33-year-old male PWS patient before and at follow-up after V-PDT: (a) digital photos before and at follow-up and (b) pseudocolor LSI maps before and at follow-up. Figure reprinted from Fig. 4 in Ref. , © 2019, with permission from Springer.
Fig. 7
Fig. 7
The method for analyzing the mean blur rate (MBR) using laser speckle flowgraphy. (a) The gray-scale map of the total measurement area. The circle and rectangle designate the area of the ONH and center placed at the tissue area avoiding the retinal vessel measured. (b) The pulse waves show changes in the MBR, which is tuned to the cardiac cycle for 4 s. The total number of frames is 118. (c) Normalization of one pulse. MBR values are provided on this screen. a, maximal MBR-minimal MBR; b, the number of frames spent at one-half value of A; c, the number of frames spent at one normalized pulse; d, the average MBR; T, temporal; N, nasal; S, superior; and I, inferior. Figure reprinted from Fig. 1 in Ref. , © 2019, with permission from Springer.
Fig. 8
Fig. 8
Temporal response (dynamics) of LSI. LSI screenshots (1 Hz) from a continuous cortical perfusion assessment in a patient after completion of a high-flow bypass graft (saphenous vein, asterisk). Panels (a)–(c) visualize cortical perfusion (a) before, (b) during, and (c) after a test-occlusion procedure of the bypass and main aneurysm-carrying vessel with subsequent flow initiation only through the bypass graft with a high flux (red) indicating high flow and low flux (blue) indicating low flow. (d) The corresponding backscatter photo. The dashed region of interest in (a)–(c) shows the area within which the main cortical perfusion was calculated. The LSCI-specific detection of a sudden flow reduction during test occlusion and immediate reperfusion after flow initiation can be noted in the second and third panels from the left. Note the absent perfusion in the bypass graft during test occlusion (asterisk). Figure reprinted from Fig. 4(a) in Ref. , © 2019, with permission from Sage Publications.
Fig. 9
Fig. 9
Representative photographs and LSCI images of (a), (b), (e), and (f) male and (c), (d), (g), and (h) female subjects; in both cases, a combination of the modified coronally advanced tunnel and Geistlich Mucograft was used. (a)–(d) Images representing the preoperative perfusion and (e)–(h) images showing the wound healing and perfusion 3 days postoperatively. Capital letters (A, B, and C) indicate the regions of interest for the blood flow evaluation. Figure reprinted from Fig. 1 in Ref. , © 2019, with permission from Hindawi.

Comment in

References

    1. Karliczek A., et al. , “Surgeons lack predictive accuracy for anastomotic leakage in gastrointestinal surgery,” Int. J. Colorectal Dis. 24(5), 569–576 (2009).IJCDE610.1007/s00384-009-0658-6 - DOI - PubMed
    1. Fercher A., Briers J., “Flow visualization by means of single-exposure speckle photography,” Opt. Commun. 37(5), 326–330 (1981).OPCOB810.1016/0030-4018(81)90428-4 - DOI
    1. Briers J. D., Webster S., “Quasi real-time digital version of single-exposure speckle photography for full-field monitoring of velocity or flow fields,” Opt. Commun. 116(1–3), 36–42 (1995).OPCOB810.1016/0030-4018(95)00042-7 - DOI
    1. Briers J. D., Webster S., “Laser speckle contrast analysis (LASCA): a nonscanning, full-field technique for monitoring capillary blood flow,” J. Biomed. Opt. 1(2), 174–179 (1996).JBOPFO10.1117/12.231359 - DOI - PubMed
    1. Richards L. M., et al. , “Low-cost laser speckle contrast imaging of blood flow using a webcam,” Biomed. Opt. Express 4(10), 2269–2283 (2013).BOEICL10.1364/BOE.4.002269 - DOI - PMC - PubMed

Publication types

MeSH terms