. 2020 Feb;26(2):170-188.
doi: 10.1080/09297049.2019.1648641. Epub 2019 Aug 6.

Prenatal socioeconomic status and social support are associated with neonatal brain morphology, toddler language and psychiatric symptoms

Affiliations

Prenatal socioeconomic status and social support are associated with neonatal brain morphology, toddler language and psychiatric symptoms

Marisa N Spann et al. Child Neuropsychol. 2020 Feb.

Abstract

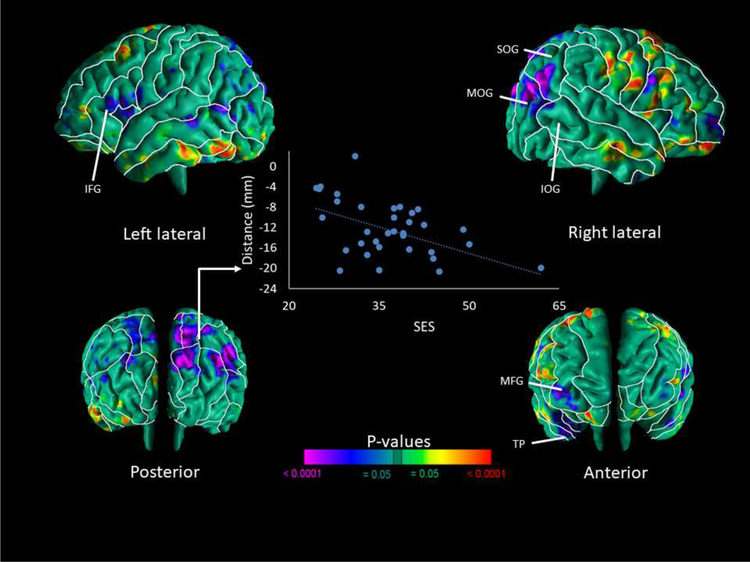
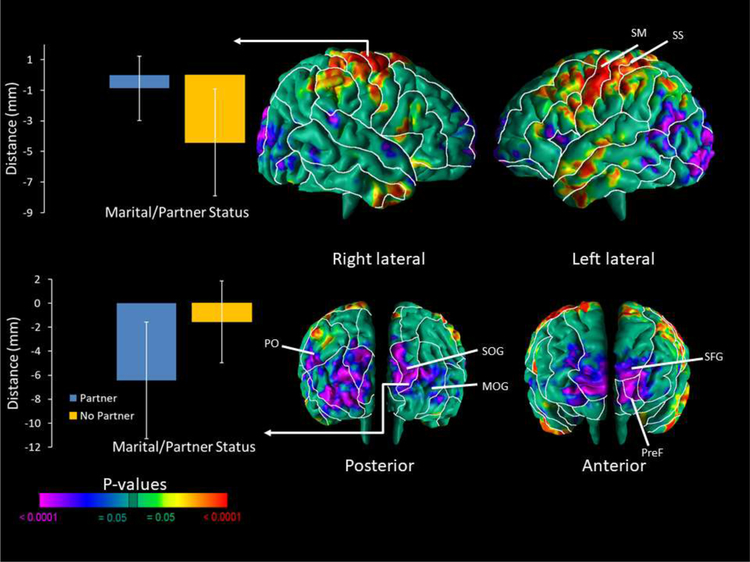
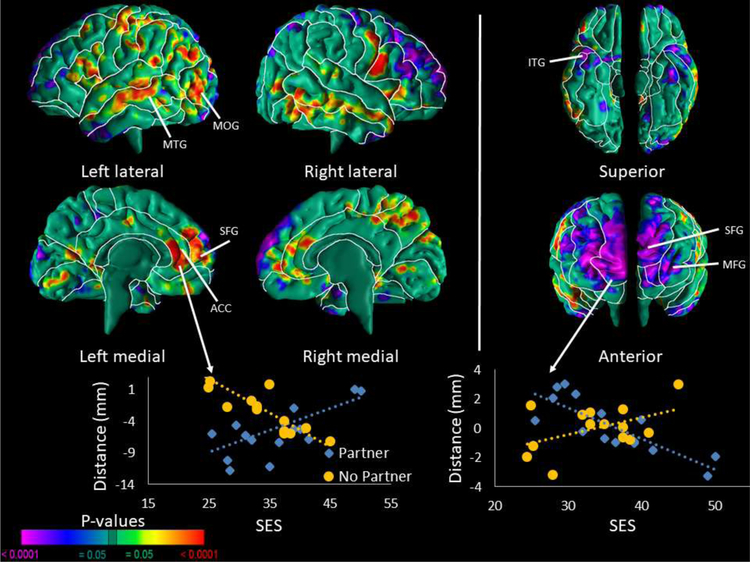
Few studies have assessed the association of parental socioeconomic status (SES) with brain measures in neonates, at a time when exposure to the postnatal environment is minimal. Social support may buffer the adverse consequences of SES, and has been associated with better cognitive - emotional development in children. We studied the association of prenatal SES and social support with neonatal brain structure, and toddler cognition, and psychiatric symptoms. In a sample of 37 healthy neonates, we correlated a measure of SES and marital/partner status (an index of social support) with morphological features of the cerebral surface measured on high-resolution MRI scans between the 1st - 6th weeks of postnatal life. We then assessed how SES relates to cognitive and behavioral outcomes at age 24-months. We found that neonates born to mothers with lower SES had greater local volumes at the surface of the right occipital lobe, left temporal pole, and left inferior frontal and anterior cingulate regions. Partner status moderated the associations of SES on neonatal brain morphology. Lower SES was associated with poorer language scores and less severe ADHD and ODD symptoms. In summary, SES was associated with neonatal brain structure and language and behavioral outcomes at toddler age. Future studies with a greater sample size and longitudinal MRI scans will help to determine whether prenatal SES continues to relate to early brain development in the same or different brain regions.

Keywords: Neonate; SES; brain; language; morphology.


Conflict of interest statement

Conflict of Interests: The authors have no conflicts of interest to disclose.

Figures

Figure 1.
Figure 1.. Correlation of Cerebral Surface Measures with SES
Maps are shown for the correlations of surface measures of the neonatal brain with SES. Results are FDR-corrected for multiple comparisons and shown in red and yellow are local protrusions and in blue and purple are local indentations of the cerebral surface, which are regarded as smaller or larger, respectively local volume of the cerebral surface. We found significant inverse correlations of local brain volumes in the infants with SES in the superior and middle occipital gyri primarily of the right hemisphere, parieto-occipital region of both hemispheres, middle frontal and temporal pole regions of the right hemisphere, and inferior frontal and anterior cingulate regions of the left hemisphere. We also detected significant positive correlations of local brain volumes in the infants with SES in the frontoparietal region of the right hemisphere and the inferior temporal lobe of the left hemisphere. The scatterplot of the inverse correlation with SES and surface measures of the SOG. Surface distances (in mm from the corresponding point on the surface template brain) are plotted on the y-axis. Blue scatter points represent SES values. Abbreviations: IFG – Inferior Frontal Gyrus; IOG – Inferior Occipital Gyrus; MFG – Medial Frontal Gyrus; MOG – Middle Occipital Gyrus; SOG – Superior Occipital Gyrus; TP – Temporal Pole.
Figure 2.
Figure 2.. Correlations of Cerebral Surface Measures with Partner Status
Maps are shown for partner status correlations with morphological measures of the cerebral surface. The p-values are adjusted for multiple comparisons with FDR. We found significant inverse correlations of local brain volumes in the neonates based on maternal partner status in the prefrontal region and diffuse across the occipital lobe of both hemispheres, and the angular gyrus of the left hemisphere. There were positive correlations of local volume in the fronto-parietal and inferior temporal regions of both hemispheres. A sample of the average local volumes (or, more accurately, distances in mm from the most significant corresponding point on the surface of the template brain in the region denoted) are displayed in bar charts for the SM and SOG of the right hemisphere. Abbreviations: PreF – Prefrontal; MOG – Middle Occipital Gyrus; PO – Parieto-occipital; SM – Somatomotor; SS – Somatosensory; SFG – Superior Frontal Gyrus; SOG – Superior Occipital Gyrus.
Figure 3.
Figure 3.. Interaction of SES with Partner Status on Cerebral Surface Measures
Correlations of surface measures with SES in infants with mothers who have a partner compared to those who do not have a partner. The p-values are adjusted for multiple comparisons with FDR. We found significant inverse correlations of local brain volumes in the neonates for the interaction of SES with partner status in the middle and superior frontal, temporal pole, and inferior temporal regions of both hemispheres, and the parieto-occipital region of the right hemisphere. The correlation suggests that neonates whose mother had lower SES and a partner compared to those whose mother did not have a partner had smaller local volumes in the regions note above. We also detected positive correlations of local volume in the middle temporal and occipital, inferior frontal, and medial superior frontal regions of both hemispheres, and anterior cingulate region of the left hemisphere. Since the right parieto-occipital and temporal pole, and left inferior frontal regions were significant in the main effect model with SES, partner status moderates SES in these brain regions. The scatterplot for this interaction are shown for the ACC of the left hemisphere and the SFG of the right hemisphere. Surface distances (in mm from the corresponding point on the surface template brain) are plotted on the y-axis. Blue scatter points represent infants whose mother had a partner and yellow scatter points represent infants whose mother did not have a partner; surface distances are in mm from the corresponding point on the surface of the template brain. Abbreviations: ACC – Anterior Cingulate; ITG – Inferior Temporal Gyrus; MTG – Middle Temporal Gyrus; MOG – Middle Occipital Gyrus; SFG – Superior Frontal Gyrus; SOG – Superior Occipital Gyrus.

References

    1. Achenbach TM, 2009. The Achenbach System of Empirically Based Assessment (ASEBA): Development, Findings, Theory, and Applications University of Vermont Research Center for Children, Youth, & Families, Burlington, VT.
    1. Arentoft A, Byrd D, Monzones J, Coulehan K, Fuentes A, Rosario A, Miranda C, Morgello S, Rivera Mindt M, 2015. Socioeconomic Status and Neuropsychological Functioning: Associations in an Ethnically Diverse HIV+ Cohort. Clin Neuropsychol 29, 232–254. - PMC - PubMed
    1. Bacharach VR, Baumeister AA, 1998. Effects of maternal intelligence, marital status, income, and home environment on cognitive development of low birthweight infants. J Pediatr Psychol 23, 197–205. - PubMed
    1. Bansal R, Gerber AJ, Peterson BS, 2008a. Brain morphometry using anatomical magnetic resonance imaging. J Am Acad Child Adolesc Psychiatry 47, 619–621. - PMC - PubMed
    1. Bansal R, Staib LH, Whiteman R, Wang YM, Peterson BS, 2005. ROC-based assessments of 3D cortical surface-matching algorithms. Neuroimage 24, 150–162. - PubMed

Publication types

LinkOut - more resources