Review
. 2019 Oct;293(1):15-29.
doi: 10.1148/radiol.2019190173. Epub 2019 Aug 6.

Imaging of Precision Therapy for Lung Cancer: Current State of the Art

Affiliations
Review

Imaging of Precision Therapy for Lung Cancer: Current State of the Art

Hyesun Park et al. Radiology. 2019 Oct.

Abstract

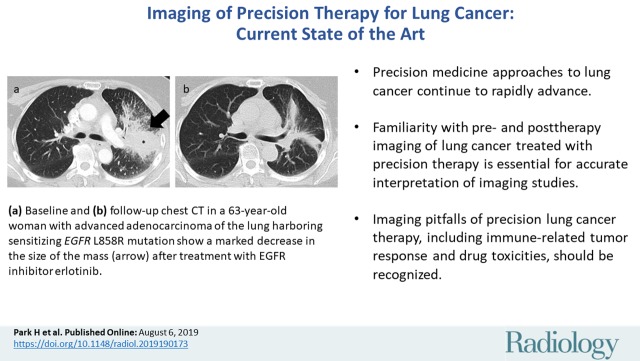
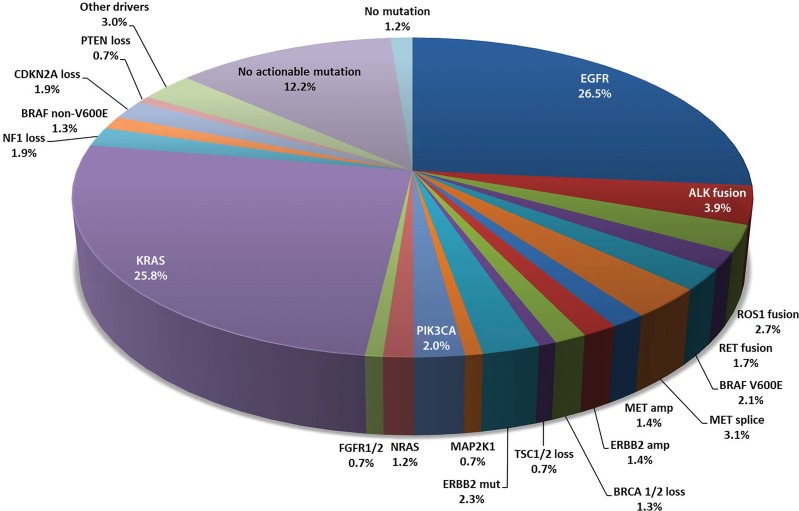
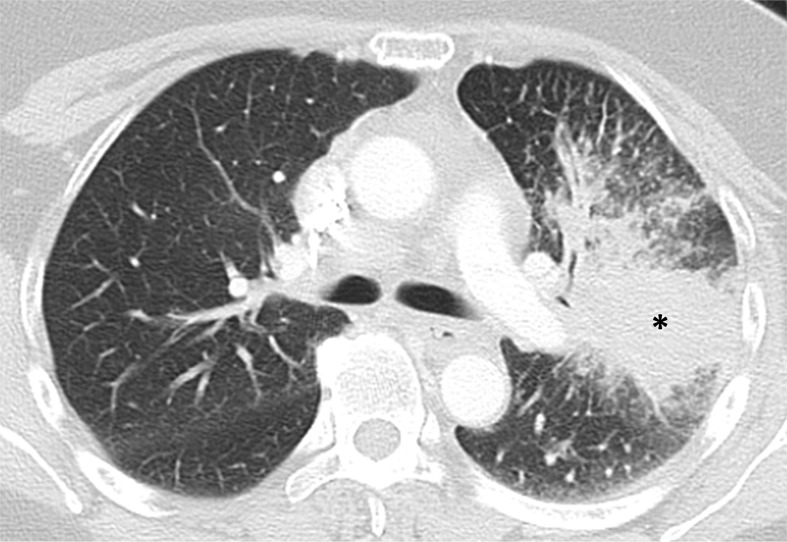
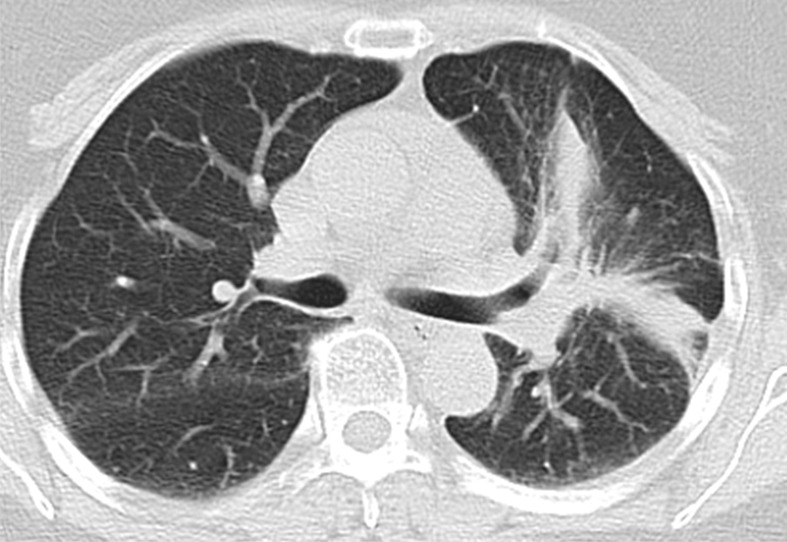
Advances in characterization of molecular and genomic abnormalities specific to lung cancer have made precision therapy the current standard of care for lung cancer treatment. This article will provide a cutting-edge review of imaging of lung cancer in the current era of precision medicine. The focus of the article includes (a) an update on the recent advances in precision therapy for non-small cell lung cancer and their implications on imaging; (b) molecular and genomic biomarkers and pitfalls of image interpretations for lung cancer precision therapy; and (c) review of the current approaches and future directions of precision imaging for lung cancer, emphasizing emerging observations in longitudinal tumor kinetics, radiomics, and molecular and functional imaging. The article is designed to help radiologists to remain up to date in the rapidly evolving world of lung cancer therapy and serve as key members of multidisciplinary teams caring for these patients.


Figures

None
Graphical abstract
Figure 1:
Figure 1:
Spectrum of oncogenic driver mutations in lung adenocarcinoma and their incidence rates. These oncogenic driver mutations are mostly mutually exclusive, except for rare exceptions. (Modified from reference .) ALK = anaplastic lymphoma kinase, Amp = amplification, BRAF = v-Raf murine sarcoma viral oncogene homolog B1, BRCA = breast cancer susceptibility gene, CDKN2A = cyclin-dependent kinase inhibitor 2A, EGFR = epidermal growth factor receptor, ERBB2 = erb-b2 receptor tyrosine kinase 2 (HER2), FGFR = fibroblast growth factor receptor, KRAS = v-Ki-ras2 Kirsten rat sarcoma viral oncogene homolog, MAP2K1 = dual specificity mitogen-activated protein kinase kinase 1, MET = mesenchymal-epithelial transition factor, Mut = mutation, NF = neurofibromin, NRAS = neuroblastoma RAS viral (v-ras) oncogene homolog, PIK3CA = phosphatidylinositol 3-kinase, PTEN = phosphatase and tensin homolog, RET = rearranged during transfection, ROS = ROS proto-oncogene 1, TSC = tuberous sclerosis.
Figure 2a:
Figure 2a:
Images in 63-year-old woman with advanced adenocarcinoma of the lung harboring sensitizing epidermal growth factor receptor (EGFR) L858R mutation who was treated with the EGFR inhibitor erlotinib. (a) Baseline chest CT image shows a large irregular mass in the left upper lobe (*) with thickening of the peribronchovascular bundle and interlobular septa, representing a primary tumor with regional lymphangitic spread. (b) Follow-up chest CT image obtained after 2 months of erlotinib therapy shows a marked decrease of the mass with residual opacities, representing response to therapy.
Figure 2b:
Figure 2b:
Images in 63-year-old woman with advanced adenocarcinoma of the lung harboring sensitizing epidermal growth factor receptor (EGFR) L858R mutation who was treated with the EGFR inhibitor erlotinib. (a) Baseline chest CT image shows a large irregular mass in the left upper lobe (*) with thickening of the peribronchovascular bundle and interlobular septa, representing a primary tumor with regional lymphangitic spread. (b) Follow-up chest CT image obtained after 2 months of erlotinib therapy shows a marked decrease of the mass with residual opacities, representing response to therapy.
Figure 3a:
Figure 3a:
Osimertinib therapy in a 63-year-old woman with advanced adenocarcinoma of the lung that originally manifested with a sensitizing epidermal growth factor receptor (EGFR) L858R mutation and initially responded well to first-line erlotinib therapy. (a) CT image obtained after 15 months of erlotinib therapy shows progression of tumor, with development of multiple new lung nodules in the right lung base (arrows). The patient started osimertinib therapy for acquired resistance to erlotinib. Rebiopsy of the right lower lobe nodule confirmed the presence of a T790M mutation. (b) Follow-up CT image obtained after 2 months of osimertinib therapy shows a near-complete resolution of the nodules, representing a marked response to osimertinib. (c) However, on a CT image obtained at 10 months of osimertinib therapy, a growth of one of the nodules in the right lower lobe (arrow) is noted, indicating progressing tumor despite osimertinib treatment. (d) CT image obtained for further follow-up at 11 months after the initiation of osimertinib shows further growth of the dominant recurrent tumor (arrow), as well as an increase in smaller lung nodules in the right lower lobe, indicating the development of acquired resistance to osimertinib.
Figure 3b:
Figure 3b:
Osimertinib therapy in a 63-year-old woman with advanced adenocarcinoma of the lung that originally manifested with a sensitizing epidermal growth factor receptor (EGFR) L858R mutation and initially responded well to first-line erlotinib therapy. (a) CT image obtained after 15 months of erlotinib therapy shows progression of tumor, with development of multiple new lung nodules in the right lung base (arrows). The patient started osimertinib therapy for acquired resistance to erlotinib. Rebiopsy of the right lower lobe nodule confirmed the presence of a T790M mutation. (b) Follow-up CT image obtained after 2 months of osimertinib therapy shows a near-complete resolution of the nodules, representing a marked response to osimertinib. (c) However, on a CT image obtained at 10 months of osimertinib therapy, a growth of one of the nodules in the right lower lobe (arrow) is noted, indicating progressing tumor despite osimertinib treatment. (d) CT image obtained for further follow-up at 11 months after the initiation of osimertinib shows further growth of the dominant recurrent tumor (arrow), as well as an increase in smaller lung nodules in the right lower lobe, indicating the development of acquired resistance to osimertinib.
Figure 3c:
Figure 3c:
Osimertinib therapy in a 63-year-old woman with advanced adenocarcinoma of the lung that originally manifested with a sensitizing epidermal growth factor receptor (EGFR) L858R mutation and initially responded well to first-line erlotinib therapy. (a) CT image obtained after 15 months of erlotinib therapy shows progression of tumor, with development of multiple new lung nodules in the right lung base (arrows). The patient started osimertinib therapy for acquired resistance to erlotinib. Rebiopsy of the right lower lobe nodule confirmed the presence of a T790M mutation. (b) Follow-up CT image obtained after 2 months of osimertinib therapy shows a near-complete resolution of the nodules, representing a marked response to osimertinib. (c) However, on a CT image obtained at 10 months of osimertinib therapy, a growth of one of the nodules in the right lower lobe (arrow) is noted, indicating progressing tumor despite osimertinib treatment. (d) CT image obtained for further follow-up at 11 months after the initiation of osimertinib shows further growth of the dominant recurrent tumor (arrow), as well as an increase in smaller lung nodules in the right lower lobe, indicating the development of acquired resistance to osimertinib.
Figure 3d:
Figure 3d:
Osimertinib therapy in a 63-year-old woman with advanced adenocarcinoma of the lung that originally manifested with a sensitizing epidermal growth factor receptor (EGFR) L858R mutation and initially responded well to first-line erlotinib therapy. (a) CT image obtained after 15 months of erlotinib therapy shows progression of tumor, with development of multiple new lung nodules in the right lung base (arrows). The patient started osimertinib therapy for acquired resistance to erlotinib. Rebiopsy of the right lower lobe nodule confirmed the presence of a T790M mutation. (b) Follow-up CT image obtained after 2 months of osimertinib therapy shows a near-complete resolution of the nodules, representing a marked response to osimertinib. (c) However, on a CT image obtained at 10 months of osimertinib therapy, a growth of one of the nodules in the right lower lobe (arrow) is noted, indicating progressing tumor despite osimertinib treatment. (d) CT image obtained for further follow-up at 11 months after the initiation of osimertinib shows further growth of the dominant recurrent tumor (arrow), as well as an increase in smaller lung nodules in the right lower lobe, indicating the development of acquired resistance to osimertinib.
Figure 4a:
Figure 4a:
Images in 77-year-old woman with anaplastic lymphoma kinase (ALK)-rearranged advanced non–small cell lung cancer who developed acquired resistance to crizotinib and subsequently responded to alectinib. (a) Baseline CT image obtained prior to crizotinib therapy shows a dominant mass in the left lower lobe (arrow) and multiple lung nodules. (b) Follow-up CT image obtained after 5 months of crizotinib therapy shows marked response to therapy, with a clinically significant reduction of the dominant lung mass (arrow) and lung nodules. However, the mass (arrow) started to grow back over the course of treatment, as noted on (c) a follow-up CT image obtained after 17 months of crizotinib therapy, indicating the development of acquired resistance to crizotinib. Crizotinib therapy was stopped, and the patient was treated with alectinib. On (d) follow-up CT image obtained after 2 months of alectinib therapy, the recurrent tumor responded to therapy (arrow).
Figure 4b:
Figure 4b:
Images in 77-year-old woman with anaplastic lymphoma kinase (ALK)-rearranged advanced non–small cell lung cancer who developed acquired resistance to crizotinib and subsequently responded to alectinib. (a) Baseline CT image obtained prior to crizotinib therapy shows a dominant mass in the left lower lobe (arrow) and multiple lung nodules. (b) Follow-up CT image obtained after 5 months of crizotinib therapy shows marked response to therapy, with a clinically significant reduction of the dominant lung mass (arrow) and lung nodules. However, the mass (arrow) started to grow back over the course of treatment, as noted on (c) a follow-up CT image obtained after 17 months of crizotinib therapy, indicating the development of acquired resistance to crizotinib. Crizotinib therapy was stopped, and the patient was treated with alectinib. On (d) follow-up CT image obtained after 2 months of alectinib therapy, the recurrent tumor responded to therapy (arrow).
Figure 4c:
Figure 4c:
Images in 77-year-old woman with anaplastic lymphoma kinase (ALK)-rearranged advanced non–small cell lung cancer who developed acquired resistance to crizotinib and subsequently responded to alectinib. (a) Baseline CT image obtained prior to crizotinib therapy shows a dominant mass in the left lower lobe (arrow) and multiple lung nodules. (b) Follow-up CT image obtained after 5 months of crizotinib therapy shows marked response to therapy, with a clinically significant reduction of the dominant lung mass (arrow) and lung nodules. However, the mass (arrow) started to grow back over the course of treatment, as noted on (c) a follow-up CT image obtained after 17 months of crizotinib therapy, indicating the development of acquired resistance to crizotinib. Crizotinib therapy was stopped, and the patient was treated with alectinib. On (d) follow-up CT image obtained after 2 months of alectinib therapy, the recurrent tumor responded to therapy (arrow).
Figure 4d:
Figure 4d:
Images in 77-year-old woman with anaplastic lymphoma kinase (ALK)-rearranged advanced non–small cell lung cancer who developed acquired resistance to crizotinib and subsequently responded to alectinib. (a) Baseline CT image obtained prior to crizotinib therapy shows a dominant mass in the left lower lobe (arrow) and multiple lung nodules. (b) Follow-up CT image obtained after 5 months of crizotinib therapy shows marked response to therapy, with a clinically significant reduction of the dominant lung mass (arrow) and lung nodules. However, the mass (arrow) started to grow back over the course of treatment, as noted on (c) a follow-up CT image obtained after 17 months of crizotinib therapy, indicating the development of acquired resistance to crizotinib. Crizotinib therapy was stopped, and the patient was treated with alectinib. On (d) follow-up CT image obtained after 2 months of alectinib therapy, the recurrent tumor responded to therapy (arrow).
Figure 5a:
Figure 5a:
Images show central nervous system (CNS) progression on crizotinib and subsequent response to alectinib in a patient with anaplastic lymphoma kinase (ALK)-rearranged advanced non–small cell lung cancer. (a) Baseline chest CT image shows dominant consolidative opacity in the right upper lobe and left lung nodules. Note right hydropneumothorax (*) due to prior thoracentesis. (b, c) The tumor responded very well to crizotinib therapy, with a small residual band-like opacity in the lung (b) after 2 years of crizotinib therapy. However, a new enhancing lesion in the right cerebellum (arrow) was noted at brain MRI, suggesting CNS progression. The patient switched therapy from crizotinib to alectinib, and the cerebellar lesion is seen to have resolved on (d) image from initial follow-up brain MRI 1.5 months after the initiation of alectinib, demonstrating higher effectiveness of alectinib for CNS lesions because of better blood-brain barrier penetration.
Figure 5b:
Figure 5b:
Images show central nervous system (CNS) progression on crizotinib and subsequent response to alectinib in a patient with anaplastic lymphoma kinase (ALK)-rearranged advanced non–small cell lung cancer. (a) Baseline chest CT image shows dominant consolidative opacity in the right upper lobe and left lung nodules. Note right hydropneumothorax (*) due to prior thoracentesis. (b, c) The tumor responded very well to crizotinib therapy, with a small residual band-like opacity in the lung (b) after 2 years of crizotinib therapy. However, a new enhancing lesion in the right cerebellum (arrow) was noted at brain MRI, suggesting CNS progression. The patient switched therapy from crizotinib to alectinib, and the cerebellar lesion is seen to have resolved on (d) image from initial follow-up brain MRI 1.5 months after the initiation of alectinib, demonstrating higher effectiveness of alectinib for CNS lesions because of better blood-brain barrier penetration.
Figure 5c:
Figure 5c:
Images show central nervous system (CNS) progression on crizotinib and subsequent response to alectinib in a patient with anaplastic lymphoma kinase (ALK)-rearranged advanced non–small cell lung cancer. (a) Baseline chest CT image shows dominant consolidative opacity in the right upper lobe and left lung nodules. Note right hydropneumothorax (*) due to prior thoracentesis. (b, c) The tumor responded very well to crizotinib therapy, with a small residual band-like opacity in the lung (b) after 2 years of crizotinib therapy. However, a new enhancing lesion in the right cerebellum (arrow) was noted at brain MRI, suggesting CNS progression. The patient switched therapy from crizotinib to alectinib, and the cerebellar lesion is seen to have resolved on (d) image from initial follow-up brain MRI 1.5 months after the initiation of alectinib, demonstrating higher effectiveness of alectinib for CNS lesions because of better blood-brain barrier penetration.
Figure 5d:
Figure 5d:
Images show central nervous system (CNS) progression on crizotinib and subsequent response to alectinib in a patient with anaplastic lymphoma kinase (ALK)-rearranged advanced non–small cell lung cancer. (a) Baseline chest CT image shows dominant consolidative opacity in the right upper lobe and left lung nodules. Note right hydropneumothorax (*) due to prior thoracentesis. (b, c) The tumor responded very well to crizotinib therapy, with a small residual band-like opacity in the lung (b) after 2 years of crizotinib therapy. However, a new enhancing lesion in the right cerebellum (arrow) was noted at brain MRI, suggesting CNS progression. The patient switched therapy from crizotinib to alectinib, and the cerebellar lesion is seen to have resolved on (d) image from initial follow-up brain MRI 1.5 months after the initiation of alectinib, demonstrating higher effectiveness of alectinib for CNS lesions because of better blood-brain barrier penetration.
Figure 6a:
Figure 6a:
Images in 75-year-old man with advanced non–small cell lung cancer with 90% programmed death-ligand 1 (PD-L1) expression at immunohistochemistry. (a) Baseline CT image shows lobulated mass in left upper lobe, consistent with primary lung cancer (arrow). (b) Follow-up CT image obtained after 2 months of nivolumab therapy shows marked tumor shrinkage, representing response to PD-1 blockade in this high PD-L1–expressing tumor (arrow).
Figure 6b:
Figure 6b:
Images in 75-year-old man with advanced non–small cell lung cancer with 90% programmed death-ligand 1 (PD-L1) expression at immunohistochemistry. (a) Baseline CT image shows lobulated mass in left upper lobe, consistent with primary lung cancer (arrow). (b) Follow-up CT image obtained after 2 months of nivolumab therapy shows marked tumor shrinkage, representing response to PD-1 blockade in this high PD-L1–expressing tumor (arrow).
Figure 7a:
Figure 7a:
Hyperprogressive disease in a 64-year-old woman with stage IV non–small cell lung cancer treated with nivolumab. (a) CT image of the abdomen obtained 2.5 months before the initiation of nivolumab therapy shows metastatic liver lesions (arrow). (b) Baseline CT image obtained immediately before the initiation of nivolumab therapy shows a moderate increase in the liver lesion (arrow) compared with a. (c) Initial follow-up CT image obtained after 2 months of nivolumab therapy shows a rapid and marked increase in the existing liver mestastasis (arrow), as well as the appearance of immunerable new liver lesions occupying majority of liver parenchyma in both lobes, indicating hyperprogressive disease on nivolumab therapy.
Figure 7b:
Figure 7b:
Hyperprogressive disease in a 64-year-old woman with stage IV non–small cell lung cancer treated with nivolumab. (a) CT image of the abdomen obtained 2.5 months before the initiation of nivolumab therapy shows metastatic liver lesions (arrow). (b) Baseline CT image obtained immediately before the initiation of nivolumab therapy shows a moderate increase in the liver lesion (arrow) compared with a. (c) Initial follow-up CT image obtained after 2 months of nivolumab therapy shows a rapid and marked increase in the existing liver mestastasis (arrow), as well as the appearance of immunerable new liver lesions occupying majority of liver parenchyma in both lobes, indicating hyperprogressive disease on nivolumab therapy.
Figure 7c:
Figure 7c:
Hyperprogressive disease in a 64-year-old woman with stage IV non–small cell lung cancer treated with nivolumab. (a) CT image of the abdomen obtained 2.5 months before the initiation of nivolumab therapy shows metastatic liver lesions (arrow). (b) Baseline CT image obtained immediately before the initiation of nivolumab therapy shows a moderate increase in the liver lesion (arrow) compared with a. (c) Initial follow-up CT image obtained after 2 months of nivolumab therapy shows a rapid and marked increase in the existing liver mestastasis (arrow), as well as the appearance of immunerable new liver lesions occupying majority of liver parenchyma in both lobes, indicating hyperprogressive disease on nivolumab therapy.
Figure 8:
Figure 8:
Overview of radiomics, the processing of radiologic imaging data. (Reprinted, with permission, from reference .) Regions of interest (ROIs) are segmented for the whole tumor, and multiple quantitative features are extracted. Combining information from multiple imaging modalities provides a multispectral view of the tumor and allows improved tumor characterization. Discovering relationships among the radiomic features and genomic, pathologic, and clinical data is a challenging but important step. MRS = MR spectroscopy.

References

    1. Jordan EJ, Kim HR, Arcila ME, et al. Prospective Comprehensive Molecular Characterization of Lung Adenocarcinomas for Efficient Patient Matching to Approved and Emerging Therapies. Cancer Discov 2017;7(6):596–609. - PMC - PubMed
    1. Gazdar AF. Personalized medicine and inhibition of EGFR signaling in lung cancer. N Engl J Med 2009;361(10):1018–1020. - PMC - PubMed
    1. Lynch TJ, Bell DW, Sordella R, et al. Activating mutations in the epidermal growth factor receptor underlying responsiveness of non-small-cell lung cancer to gefitinib. N Engl J Med 2004;350(21):2129–2139. - PubMed
    1. Pao W, Miller V, Zakowski M, et al. EGF receptor gene mutations are common in lung cancers from “never smokers” and are associated with sensitivity of tumors to gefitinib and erlotinib. Proc Natl Acad Sci U S A 2004;101(36):13306–13311. - PMC - PubMed
    1. Paez JG, Jänne PA, Lee JC, et al. EGFR mutations in lung cancer: correlation with clinical response to gefitinib therapy. Science 2004;304(5676):1497–1500. - PubMed

Publication types

MeSH terms

Substances