. 2019 Aug 6:8:e42496.
doi: 10.7554/eLife.42496.

Dengue genetic divergence generates within-serotype antigenic variation, but serotypes dominate evolutionary dynamics

Affiliations

Dengue genetic divergence generates within-serotype antigenic variation, but serotypes dominate evolutionary dynamics

Sidney M Bell et al. Elife. .

Abstract

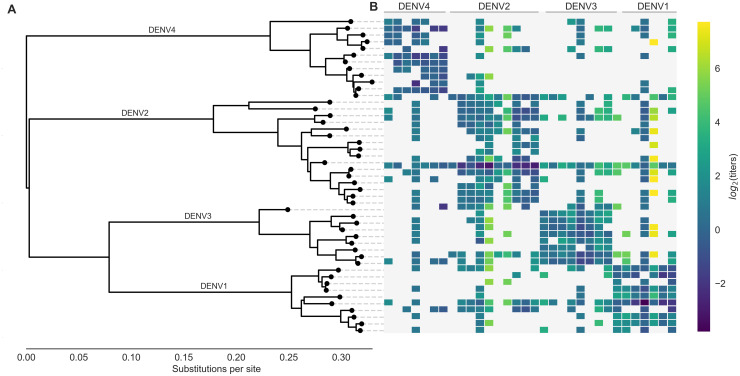
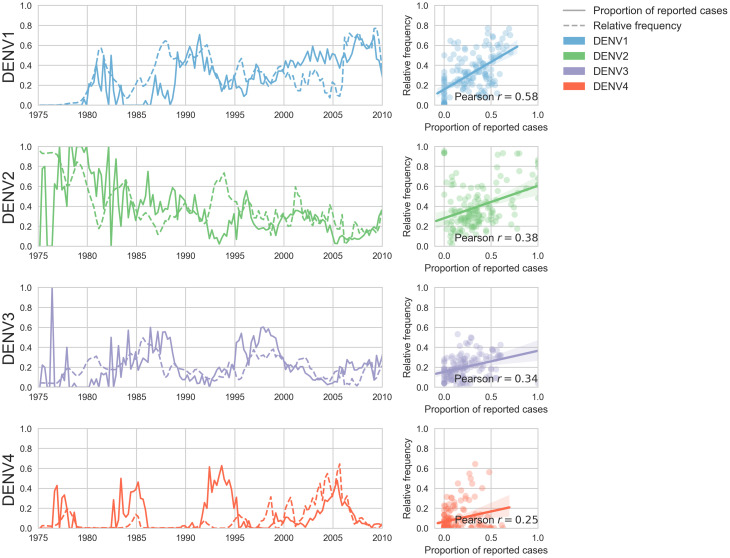
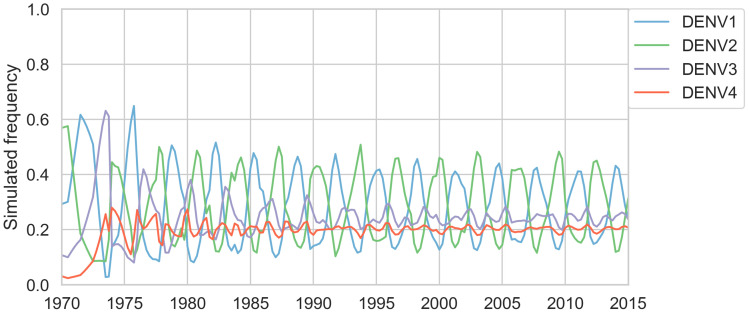
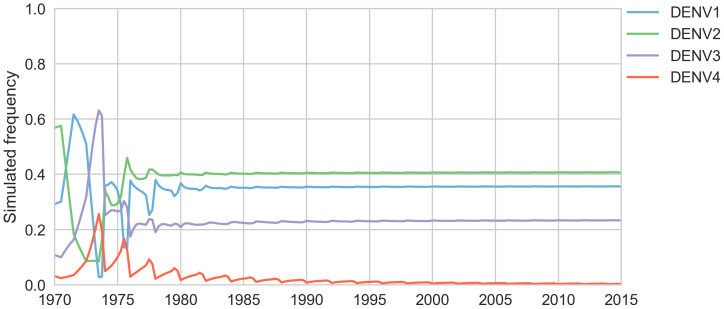
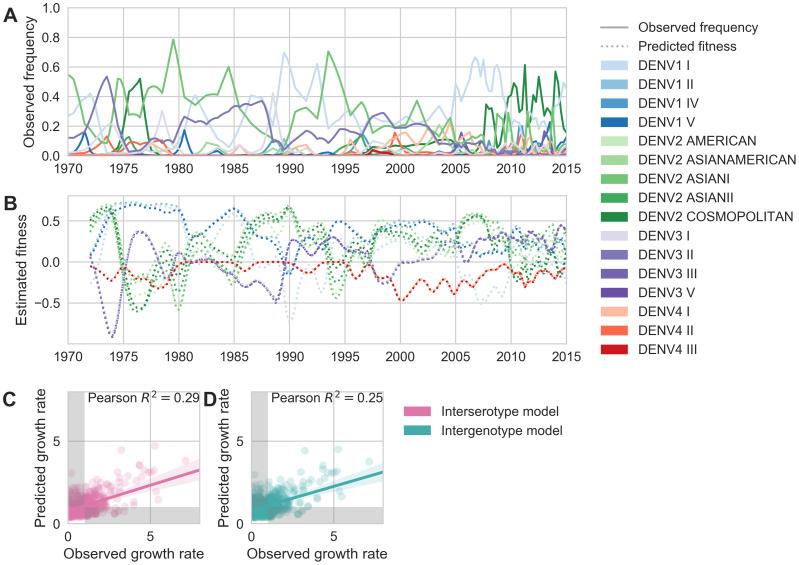
Dengue virus (DENV) exists as four genetically distinct serotypes, each of which is historically assumed to be antigenically uniform. Recent analyses suggest that antigenic heterogeneity may exist within each serotype, but its source, extent and impact remain unclear. Here, we construct a sequence-based model to directly map antigenic change to underlying genetic divergence. We identify 49 specific substitutions and four colinear substitution clusters that robustly predict dengue antigenic relationships. We report moderate antigenic diversity within each serotype, resulting in genotype-specific patterns of heterotypic cross-neutralization. We also quantify the impact of antigenic variation on real-world DENV population dynamics, and find that serotype-level antigenic fitness is a dominant driver of dengue clade turnover. These results provide a more nuanced understanding of the relationship between dengue genetic and antigenic evolution, and quantify the effect of antigenic fitness on dengue evolutionary dynamics.

Keywords: antigenic evolution; dengue; evolutionary biology; infectious disease; microbiology; viral fitness; virus.


Conflict of interest statement

SB, LK, TB No competing interests declared

Figures

Figure 1.
Figure 1.. Phylogeny of dengue virus sequences and normalized antigenic distances.
(A) Maximum likelihood phylogeny of the E (envelope) gene from titered dengue viruses. Notably, each of the four serotypes contains substantial genetic diversity. (B) Pairwise antigenic distances were estimated by Katzelnick et al. (2015) using plaque reduction neutralization titers (PRNT50, see Materials and methods). Aggregated titer values are standardized such that the distance between autologous virus-serum pairs is 0, and each titer unit corresponds to a two-fold change in PRNT50 value. Light gray areas represent missing data. Larger values correspond to greater antigenic distance.
Figure 1—figure supplement 1.
Figure 1—figure supplement 1.. Titer value symmetry.
Some viruses have greater avidity overall, and some sera are more potent overall. We normalize for these row and column effects (vi and pj, respectively) in the titer model. Once overall virus avidity and serum potency are accounted for, titers are roughly symmetric (i.e., DijDji).
Figure 2.
Figure 2.. Distribution and effect size of antigenic mutations.
Each point represents one antigenically relevant mutation or colinear mutation cluster. Clustered mutations are connected with dashed lines with point size proportionate to cluster size (N = 2–6). The x axis indicates mutations’ position in E, relative to each functional domain as noted in (B). The y axis indicates antigenic effect size.
Figure 2—figure supplement 1.
Figure 2—figure supplement 1.. Genotype as site E 390 across dengue phylogeny.
Dengue virus genotypes can be seen on Nextstrain (Hadfield et al., 2018). A live view of this figure is available at nextstrain.org/dengue/.
Figure 2—figure supplement 2.
Figure 2—figure supplement 2.. Titer prediction error by serum strain and species.
Human sera was raised against four different virus strains (the monovalent vaccine components); non-human primate (NHP) sera was raised against many different virus strains. Here, we excluded NHP sera raised against the monovalent vaccine components, such that each normalized titer measurement is aggregated across individuals, but not across species. We report the out-of-sample titer prediction error for each serum strain (versus all available test viruses), aggregated across 100-fold Monte Carlo cross-validation.
Figure 3.
Figure 3.. Antigenic distance from NIH vaccine strains.
By assigning a discrete increment of antigenic change to each mutation, we can estimate the asymmetrical antigenic distance between any serum strain and test virus strain based on their genetic differences. Here, we show the estimated antigenic distance between serum raised against each monovalent component of the NIH vaccine candidate (indicated as ‘X’) and each test virus in the tree.
Figure 4.
Figure 4.. Titer distance by genotype.
Values represent the mean interpolated antigenic distance between canonical dengue genotypes (in standardized log2 titer units). Columns represent sera; rows represent test viruses.
Figure 5.
Figure 5.. Antigenic novelty predicts serotype success.
(A) The relative frequency of each serotype, xi, in Southeast Asia estimated every 3 months based on available sequence data. (B) Total fitness of each serotype. We calculate antigenic fitness for each serotype over time as its frequency-weighted antigenic distance from recently circulating viruses. We then add this to a time-invariant intrinsic fitness value to calculate total fitness. (C) DENV1 frequencies between 1994 and 1996 alongside model projection. At each timepoint t, we blind the model to all empirical data from timepoints later than t and predict each serotype’s future trajectory based on its initial frequency, time-invariant intrinsic fitness, and antigenic fitness at time t (Materials and methods, Equation 11). We predict forward in 3-month increments for a total prediction period of dt=2 years. At each increment, we use the current predicted frequency to adjust our estimates of antigenic fitness on a rolling basis (Materials and methods, Equation 15). (D) Predicted growth rates, g^=xi^(t+dt)xi(t), compared to empirically observed growth rates, g=xi(t+dt)xi(t). Predicted and empirical growth rate of the example illustrated in (C) is shown in (D) as the blue point. Serotype growth versus decline is accurate (i.e. the predicted and actual growth rates are both >1 or both <1, all points outside the gray area) for 66% of predictions.
Figure 5—figure supplement 1.
Figure 5—figure supplement 1.. Case counts versus clade frequencies in Thailand.
As described in the Materials and methods, we estimate clade frequencies based on observed relative abundance in the ‘slice’ of the phylogeny at each quarterly timepoint. These frequency estimates are smoothed using a discretized Brownian motion diffusion process. Here, we compare estimated serotype frequencies across Thailand (all available high quality sequences) to case counts from a hospital in Bangkok between 1975–2010 (Reich et al., 2013). Biweekly case counts were aggregated into quarterly timepoints, but were not smoothed. While there are some instances where case counts and frequencies diverge (e.g. DENV4 in the early 1990s), the noisy nature of the unsmoothed case counts artificially deflates estimates of concordance.
Figure 5—figure supplement 2.
Figure 5—figure supplement 2.. Simulated serotype frequencies (model parameters).
As described in the Materials and methods, we seeded a simulation with two years of empirical frequencies and predicted forward to simulate the remainder of the timecourse. Here, we simulated under the model parameters described in Table 2. This results in damped oscillations around the intrinsic fitness value for each serotype, but these intrinsic fitnesses alone are unable to predict observed clade dynamics (Table 3).
Figure 5—figure supplement 3.
Figure 5—figure supplement 3.. Simulated serotype frequencies.
As described in the Materials and methods, we seeded a simulation with 2 years of empirical frequencies and predicted forward to simulate the remainder of the timecourse. Here, we simulated under the model parameters described in Table 5.
Figure 6.
Figure 6.. Antigenic novelty partially predicts genotype success.
(A) Relative frequencies of each canonical dengue genotype across Southeast Asia, estimated from available sequence data. (B) Antigenic fitness is calculated for each genotype as its frequency-weighted antigenic distance from recently circulating genotypes. We then add this to a time-invariant, serotype-specific intrinsic fitness value to calculate total fitness (shown here, arbitrary units). We assess antigenic distance at either the ‘intergenotype’ or the ‘interserotype’ resolution. In this panel, we show total fitness over time, incorporating estimates of antigenic fitness derived from the ‘intergenotype’ model. (C, D) Fitness estimates were used to predict clade growth rates over 2 years, compounding immunity every 3 months based on predicted frequency changes (Materials and methods Equation 15). Here, we compare observed vs. predicted growth rates for both formulations of the fitness model (using fitness derived from either ‘interserotype’ or ‘intergenotype’ antigenic distances). Growth versus decline was accurate (predicted and actual growth rates both >1 or both <1, points outside the gray shaded area) for 67% and 61% of predictions, respectively.

References

    1. Allicock OM, Lemey P, Tatem AJ, Pybus OG, Bennett SN, Mueller BA, Suchard MA, Foster JE, Rambaut A, Carrington CV. Phylogeography and population dynamics of dengue viruses in the americas. Molecular Biology and Evolution. 2012;29:1533–1543. doi: 10.1093/molbev/msr320. - DOI - PMC - PubMed
    1. Andersen M, Dahl J, Vandenberghe L. CVXOPT: a Python package for convex optimization. Abel Ee Ucla Edu/cvxopt 2013
    1. Bedford T, Cobey S, Pascual M. Strength and tempo of selection revealed in viral gene genealogies. BMC Evolutionary Biology. 2011;11:220. doi: 10.1186/1471-2148-11-220. - DOI - PMC - PubMed
    1. Bedford T, Rambaut A, Pascual M. Canalization of the evolutionary trajectory of the human influenza virus. BMC Biology. 2012;10:38. doi: 10.1186/1741-7007-10-38. - DOI - PMC - PubMed
    1. Bhatt S, Gething PW, Brady OJ, Messina JP, Farlow AW, Moyes CL, Drake JM, Brownstein JS, Hoen AG, Sankoh O, Myers MF, George DB, Jaenisch T, Wint GR, Simmons CP, Scott TW, Farrar JJ, Hay SI. The global distribution and burden of dengue. Nature. 2013;496:504–507. doi: 10.1038/nature12060. - DOI - PMC - PubMed

Publication types