Review
. 2019 Jan;6(1):4-16.
doi: 10.1093/nop/npy041. Epub 2018 Nov 5.

Molecular tools for the pathologic diagnosis of central nervous system tumors

Affiliations
Review

Molecular tools for the pathologic diagnosis of central nervous system tumors

Loudy P Priesterbach-Ackley et al. Neurooncol Pract. 2019 Jan.

Abstract

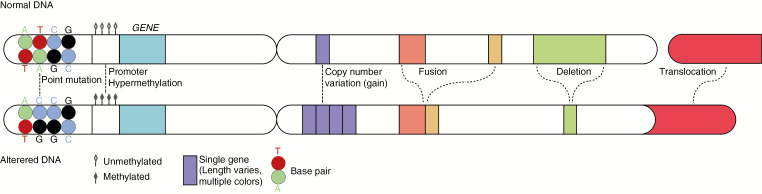
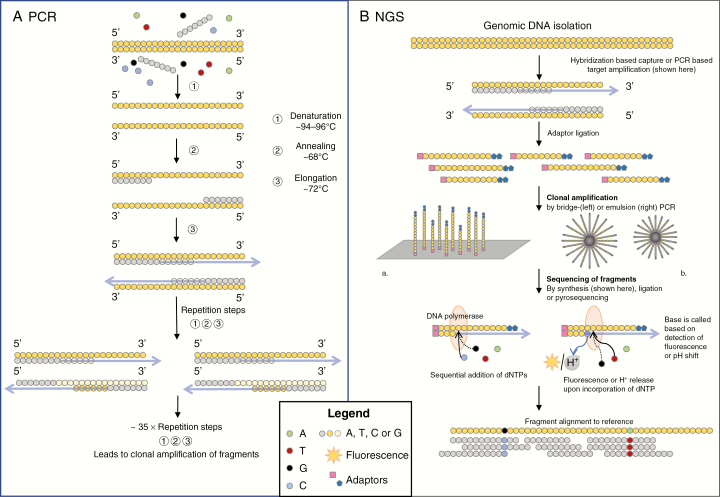
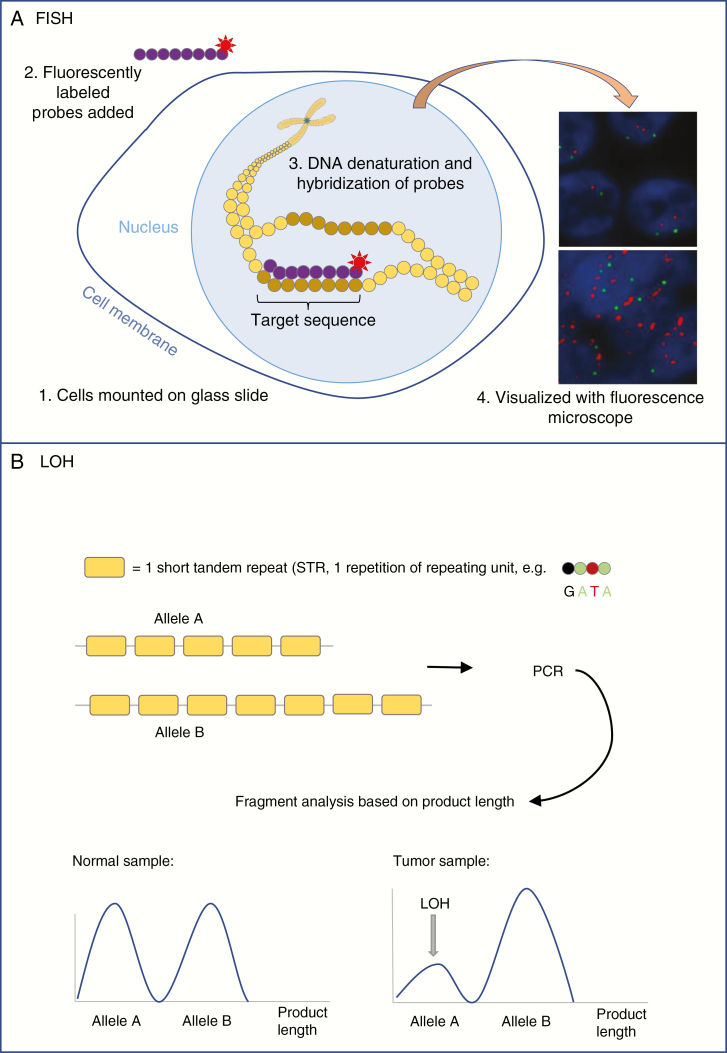
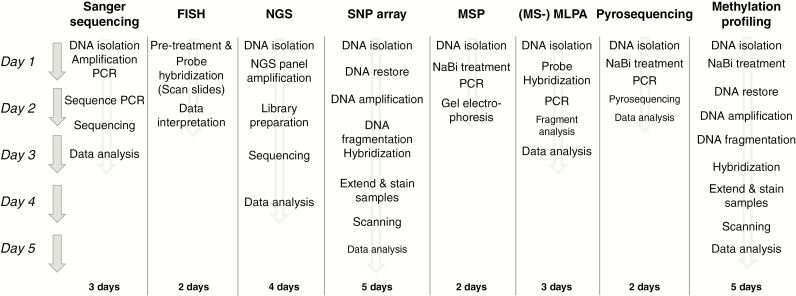
Molecular diagnostics currently has a crucial role in neuro-oncological patient care. (Epi)genetic assays testing for point mutations, copy number variations, gene fusions, translocations, and methylation status are of main diagnostic interest in neuro-oncology. Multiple assays have been developed for this purpose, ranging from single gene tests to high-throughput, integrated techniques enabling detection of multiple genetic aberrations in a single workflow. This review describes the nature of the simpler and more complex assays for molecular diagnostics of tumors of the central nervous system and briefly discusses their strengths and weaknesses.

Keywords: diagnosis; epigenetics; genetic alterations; molecular pathology; neuro-oncology.


Figures

Fig. 1
Fig. 1
Simplified representation of the nature of the most relevant (epi)genetic alterations in (neuro-)oncology. Normal DNA is displayed at the top, with part of another chromosome to the right. At the bottom, altered DNA is represented. The depicted alterations are examples. The mutation shows a change from a cytosine (C)-guanine (G) base pair to a thymine (T)-adenosine (A) base pair. A copy number change may involve a loss/deletion or a gain/amplification, of which the latter is shown here (from 1 to 4 copies of a single gene). The depicted deletion now involves loss of part of 1 single gene, but a deletion may also concern loss of a partial or whole chromosome arm. A gene fusion, depicted as a fusion between genes that were already on the same chromosome arm, may also concern fusion between genes originating on different chromosome arms. The translocation shows the addition of part of 1 arm of a chromosome to the arm of another chromosome.
Fig. 2
Fig. 2
A, Simplified diagram showing the basic steps in polymerase chain reaction (PCR). A mixture of DNA, primers, enzymes, and dideoxynucleotide triphosphates is made. Then, a PCR cycle is started in which the temperature regulates the reactions. DNA is denatured (~95oC), primers anneal (~55 oC-60oC), and primers are elongated (~72oC) using the original DNA as a template. Next, PCR cycles are repeated ~35× with the new PCR products and DNA as a template. Repetition of PCR cycles leads to an exponential increase in DNA fragments with the same sequence. Next, the fragments can be analyzed. B, A simplified diagram showing the essentials of targeted next-generation sequencing technology. Genomic DNA is fragmented and adaptors are ligated, which help to anchor the DNA fragments to a solid surface (a plate in bridge PCR or a bead in emulsion PCR). DNA fragments are amplified through a PCR reaction. DNA polymerase causes elongation of the complementary sequence, and the release of fluorescence or hydrogen upon the incorporation of a nucleotide is analyzed to find the sequence of each fragment. To identify a mutation, the sequences of the fragments are digitally aligned to the sequence of reference DNA.
Fig. 3
Fig. 3
A, Simplified diagram showing the essential technique of fluorescent in situ hybridization (FISH). Tissue is mounted on a glass slide and cells are treated to make cell membranes and nuclei permeable to enzymes and probes. DNA is denatured and fluorescently labeled probes (eg, complementary to target sequence [red label] and centromere [green label]) are hybridized to the DNA. The fluorescent labels can be visualized with a fluorescence microscope. Normal signal for EGFR (upper panel) and EGFR amplification (bottom panel) are shown. B, Simplified diagram showing the basis of STR-based LOH analysis. For a certain gene, allele A carries 5 STRs while allele B carries 7 copies of that STR. Polymerase chain reaction is performed (see Figure 2), after which the fragments are analyzed based on their length. The ratio between fragments of different lengths gives information on the presence or absence of the alleles. LOH is declared when the presence of 1 of the alleles is lower than expected from the matched normal sample, and when the ratio between the signals for fragments of both alleles is disturbed. EGFR indicates epidermal growth factor receptor; LOH, loss of heterozygosity; STR, short tandem repeat.
Fig. 4
Fig. 4
Flow diagram providing an indication of turnaround times (in working days) for several of the techniques described in this review article. These are the usual turnaround times of the authors’ laboratory or institution. Turnaround times may vary from laboratory to laboratory, for example, depending on the possibility of performing certain steps overnight. FISH indicates fluorescent in situ hybridization; MS-MLPA, methylation-specific multiplex ligation-dependent probe amplification; MSP, methylation-specific polymerase chain reaction; NaBi, sodium bisulfite; NGS, next-generation sequencing; PCR, polymerase chain reaction; SNP, single-nucleotide polymorphism.
Fig. 5
Fig. 5
Simplified diagrams of 3 techniques that can be used to assess methyl guanine methyl transferase gene (MGMT) promoter methylation status. A, In MS-MLPA DNA is denatured and gene-specific probes are hybridized to the genomic DNA. The probes contain stuffer sequences of different length, allowing multiplex analysis. Every reaction consists of 2 routes. One route is incubated with ligase and the other with ligase and the methylation-specific restriction enzyme HhaI. The first reaction allows for the identification of copy number variations, whereas the second allows for methylation analysis as the restriction enzyme digests only unmethylated DNA (because unmethylated DNA and methylated DNA are added). B, The methylation-specific PCR genomic DNA is treated with sodium bisulfite (NaBi). Next, a PCR reaction with specific primers for either completely methylated or unmethylated DNA is performed. After gel electrophoresis, presence of bands for the methylated primers indicates the presence of DNA methylation. C, For pyrosequencing DNA is treated with NaBi. Next, a PCR reaction is performed to amplify the region of interest. Finally, the PCR product is sequenced. Upon incorporation of a nucleotide by DNA polymerase, a pyrophosphate (PPi) molecule is released that can be converted into light by sulfurylase and luciferase. As single nucleotides are added to the reaction in a specific order, the presence of a light signal indicates the presence of that nucleotide in the sequence. MS-MLPA indicates methylation-specific multiplex ligation-dependent probe amplification; PCR, polymerase chain reaction.

References

    1. Louis DN, Ohgaki H, Wiestler OD, Cavenee WK. World Health Organization Histological Classification of Tumours of the Central Nervous System. France: International Agency for Research on Cancer; 2016.
    1. The Cancer Genome Atlas Research Network, Brat DJ, Verhaak RG, et al.Comprehensive, integrative genomic analysis of diffuse lower-grade gliomas. N Engl J Med. 2015;372(26):2481–2498. doi:10.1056/NEJMoa1402121 - PMC - PubMed
    1. Brat DJ, Aldape K, Colman H, et al. . cIMPACT-NOW update 3: grading of IDH-wildtype diffuse astrocytic gliomas [published online ahead of print September 26, 2018]. Acta Neuropathol. doi:10.1007/s00401-018-1913-0 - PMC - PubMed
    1. Wesseling P, Capper D. WHO 2016 classification of gliomas. Neuropathol Appl Neurobiol. 2018;44(2):139–150. doi:10.1111/nan.12432 - PubMed
    1. Pickles JC, Hawkins C, Pietsch T, Jacques TS. CNS embryonal tumours: WHO 2016 and beyond. Neuropathol Appl Neurobiol. 2018;44(2):151–162. doi:10.1111/nan.12443 - PubMed