. 2019 Aug 6;17(8):e3000387.
doi: 10.1371/journal.pbio.3000387. eCollection 2019 Aug.

Strategic deployment of feature-based attentional gain in primate visual cortex

Affiliations

Strategic deployment of feature-based attentional gain in primate visual cortex

Vladislav Kozyrev et al. PLoS Biol. .

Abstract

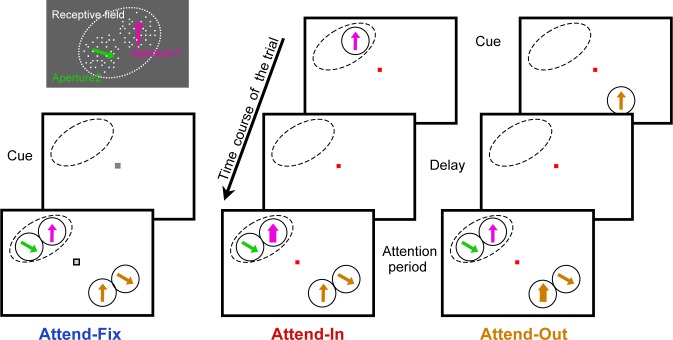
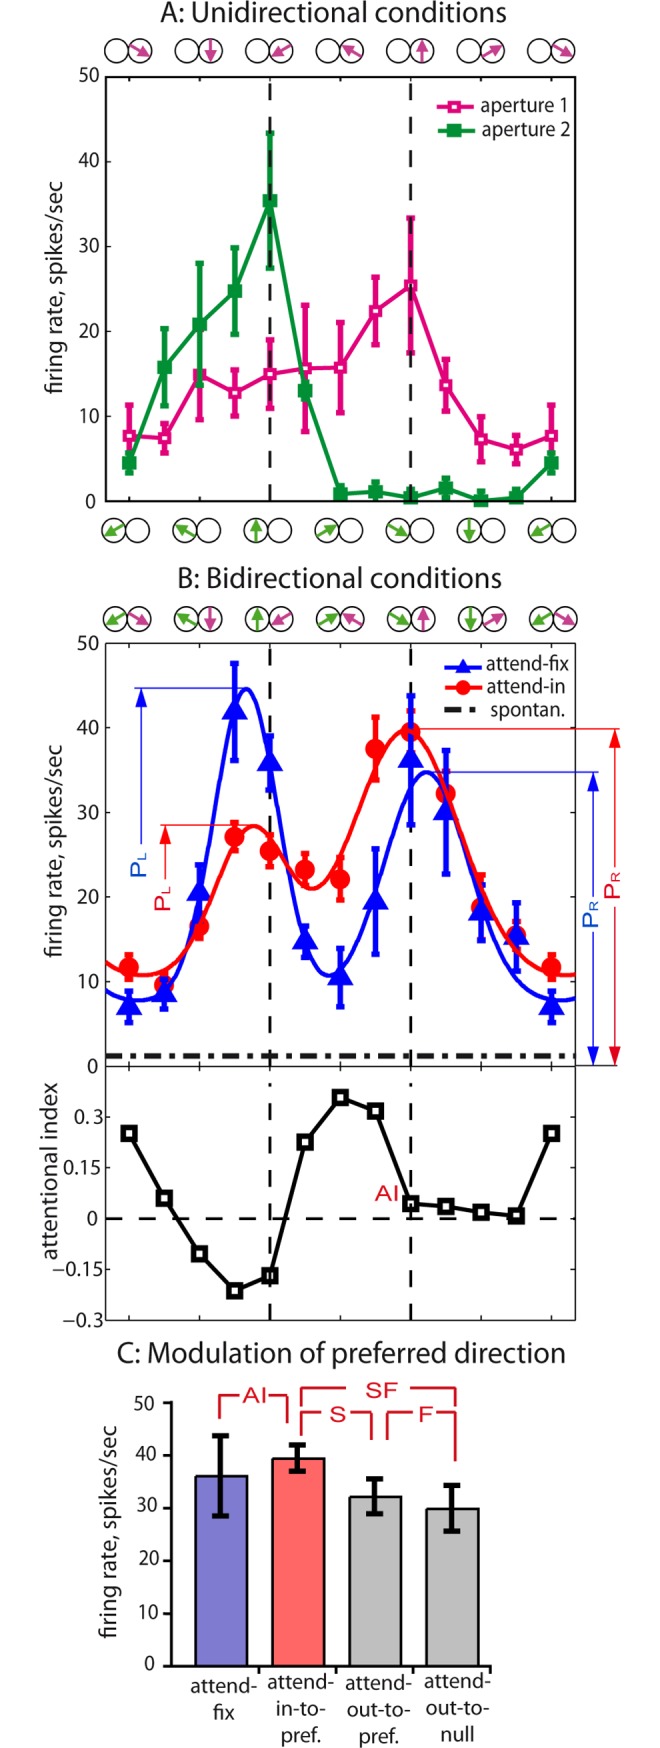
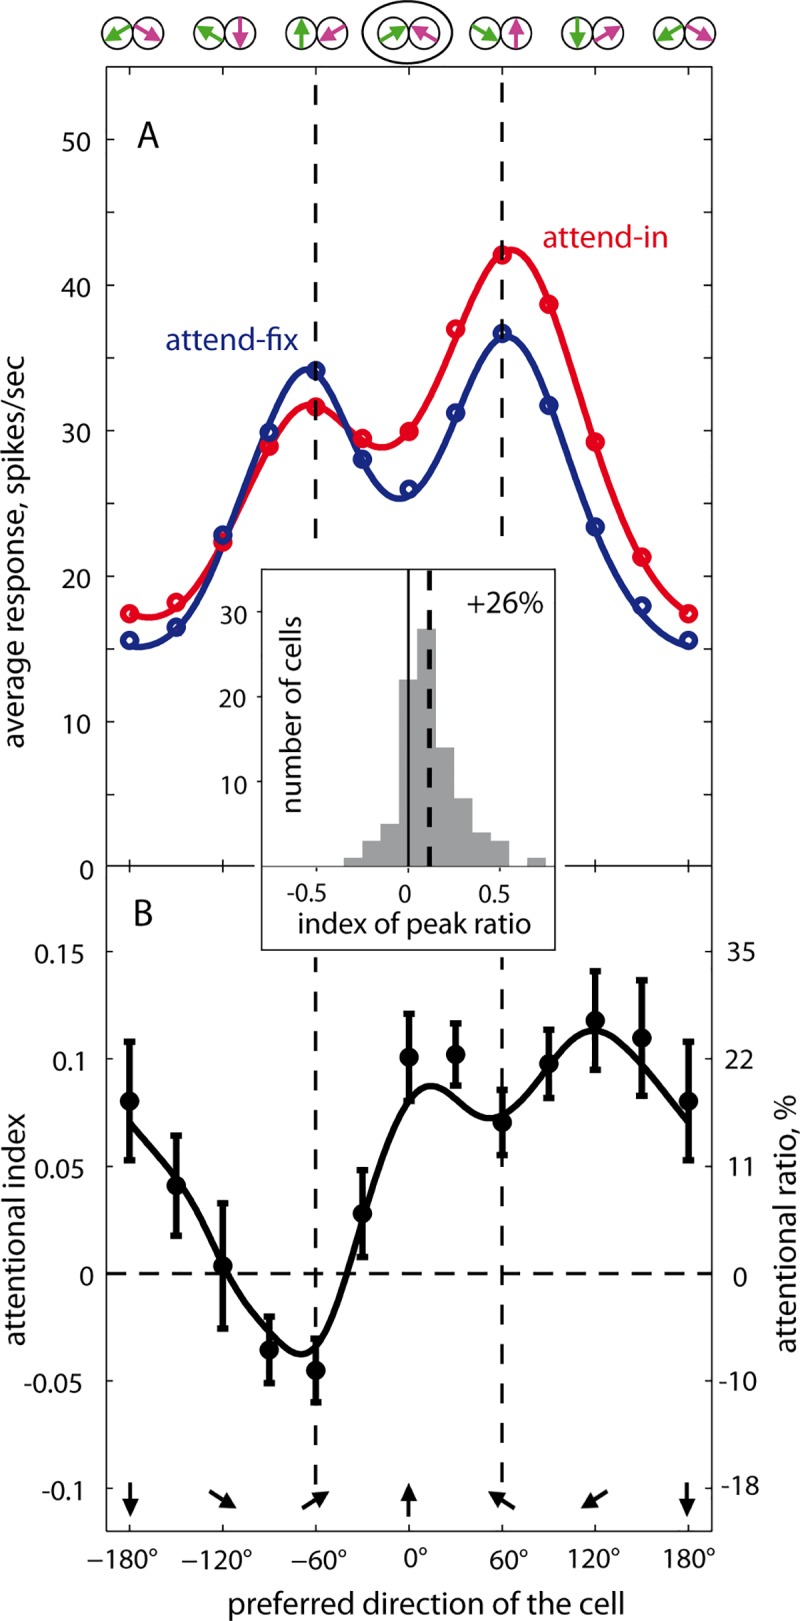
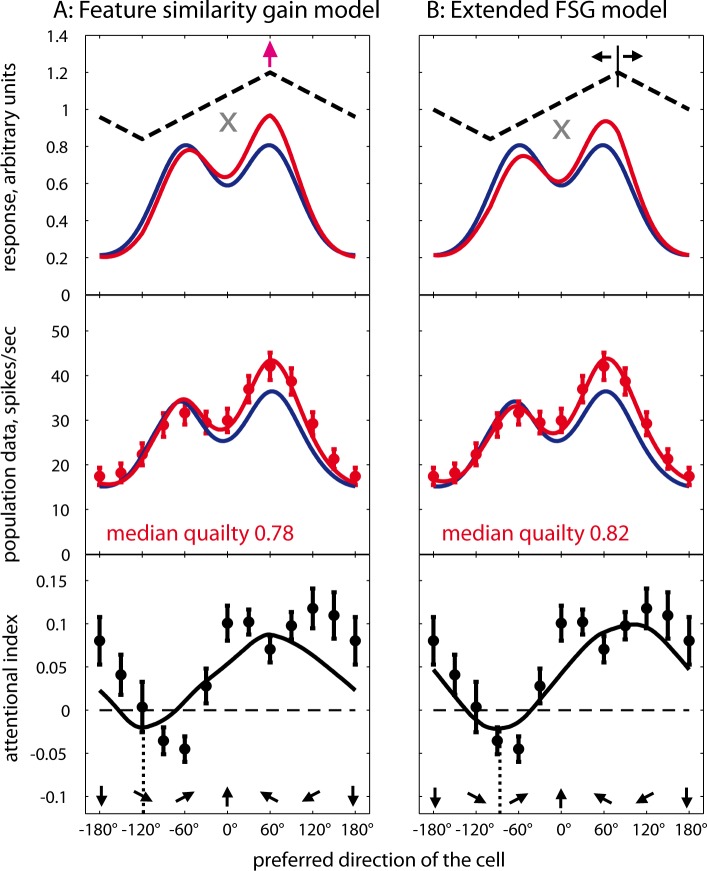
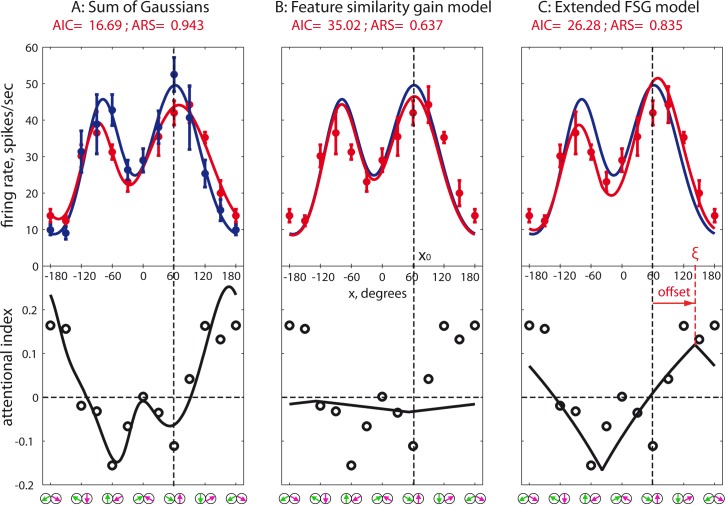
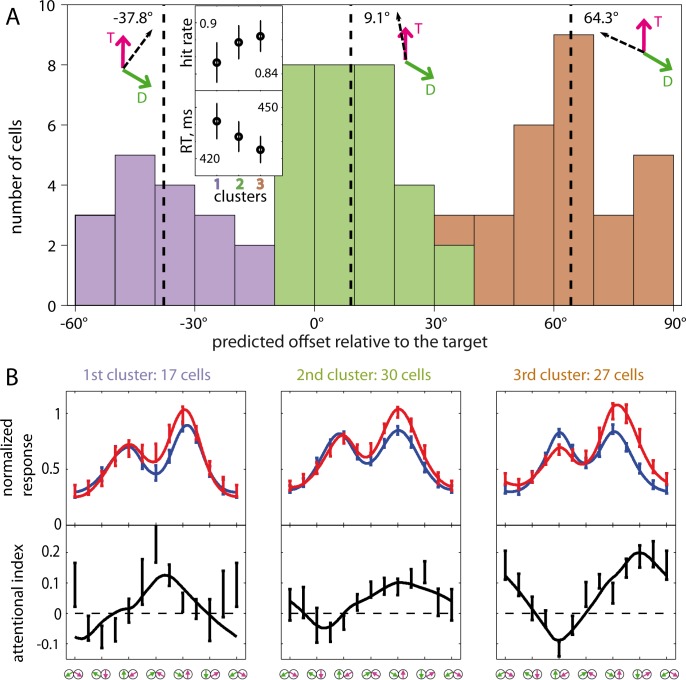
Attending to visual stimuli enhances the gain of those neurons in primate visual cortex that preferentially respond to the matching locations and features (on-target gain). Although this is well suited to enhance the neuronal representation of attended stimuli, it is nonoptimal under difficult discrimination conditions, as in the presence of similar distractors. In such cases, directing attention to neighboring neuronal populations (off-target gain) has been shown to be the most efficient strategy, but although such a strategic deployment of attention has been shown behaviorally, its underlying neural mechanisms are unknown. Here, we investigated how attention affects the population responses of neurons in the middle temporal (MT) visual area of rhesus monkeys to bidirectional movement inside the neurons' receptive field (RF). The monkeys were trained to focus their attention onto the fixation spot or to detect a direction or speed change in one of the motion directions (the "target"), ignoring the distractor motion. Population activity profiles were determined by systematically varying the patterns' directions while maintaining a constant angle between them. As expected, the response profiles show a peak for each of the 2 motion directions. Switching spatial attention from the fixation spot into the RF enhanced the peak representing the attended stimulus and suppressed the distractor representation. Importantly, the population data show a direction-dependent attentional modulation that does not peak at the target feature but rather along the slopes of the activity profile representing the target direction. Our results show that attentional gains are strategically deployed to optimize the discriminability of target stimuli, in line with an optimal gain mechanism proposed by Navalpakkam and Itti.


Conflict of interest statement

The authors have declared that no competing interests exist.

Figures

Fig 1
Fig 1. Visual stimulus and behavioral task.
The panel in the upper left shows an example of the stimulus layout in the RF with the luminance polarity used in the experiment. We used bidirectional motion patterns composed of 2 adjacent but spatially separated RDP that moved within 2 stationary virtual apertures placed within the classical RF of a mapped MT neuron (white dashed line). The dots were white, on a gray background. Directions of the movement were systematically varied, keeping the angle between them constant and equal to 120°. In the attend-fix condition (left panel), the monkey was trained to detect a luminance change in the fixation spot while 2 motion components were presented in the RF and 2 other components outside the RF. The directions of the latter were randomly picked. In the other 2 conditions, the same visual stimuli were shown inside the RF but the monkey was cued either to one of the patterns (the right one, as depicted here) within the RF (attend-in condition, middle panel) or to a pattern outside the RF (attend-out condition, right panel), while maintaining its gaze on the fixation spot throughout each trial. The cue (marked by arrows: magenta in the middle top panel and orange in the right one) appeared at the same location and moved in the same direction as the target. Both the target (marked by a thicker arrow) and distractor patterns appeared simultaneously after a delay. The monkey was required to detect a transient change of either speed or direction of motion in the target RDP. MT, middle temporal; RDP, random dot pattern; RF, receptive field.
Fig 2
Fig 2. Responses of an example neuron H073-01+01.
(A) Tuning to unidirectional stimuli presented in each of 2 patterns in the RF when attending to the fixation spot. The average was taken across 5 to 7 trials, error bars show 1 SEM. Motion directions of the respective pattern are depicted separately along the top and bottom x-axes. The upward arrow represents the stimulus direction that was closest to the neuron’s preferred direction. The color of the curves corresponds to the color of the arrows indicating a position of the respective pattern. Data points for the right pattern are marked by open squares, these for the left pattern by filled squares. Note that the tuning curves determined at the 2 different spatial positions within the RF were similar but not equal. (B) Bidirectional responses and their modulation by attention. The upper plot depicts tuning curves of responses to combined stimuli, plotting the average firing rates (across 5 to 12 trials) in the conditions attend-fix (blue triangles) and attend-in (red circles). Direction combinations in the RF are depicted along the x-axis by purple and green arrows corresponding to those in panel A. In the attend-in condition, the target always was the right RDP. The solid curves of respective colors represent the 2-Gaussian fits of the data (see Eq 4). Both curves show 2 peaks close to configurations when 1 of the 2 patterns moved in the neuron’s preferred direction (marked by vertical dashed lines). The height of the right and the left peaks predicted by the 2-Gaussian fits for the 2 conditions is denoted by PR and PL in the respective color. The average spontaneous firing across 6 trials without RDPs (attention to the fixation spot) is indicated by the horizontal dot-dashed line. The lower panel plots the attentional modulation (attend-in versus attend-fix, Eq 1) of the firing rates depicted in the upper panel. Note that strongly modulated conditions in this example don’t include the one with preferred direction in the RF (labeled by red “AI”). (C) Modulation of responses to the preferred direction in the RF in the conditions attend-fix, attend-in-to-preferred, attend-out-to-preferred, and attend-out-to-null. Comparison of the first 2 provides the AI labeled by red color in lower plot B. Comparing the latter 3 firing rates, the effects of spatial and FBA as well as their combination (indicated by the letters S, F, and SF, respectively) can be estimated. Error bars depict SEM across trials of the respective condition. For this neuron, we found on average a 22% enhancement by spatial attention (attend-in-to-preferred versus attend-out-to-preferred); FBA (attend-out-to-preferred versus attend-out-to-null) caused a 7% enhancement. The combined effect of spatial and FBA (attend-in-to-preferred versus attend-out-to-null) was 32%. The underlying data can be found in S1 Data. AI, attentional index; FBA, feature-based attention; RDP, random dot pattern; RF, receptive field.
Fig 3
Fig 3. Activity profiles and response modulation across the neuronal population.
The layout is similar to Fig 2B. See also S7 Fig presenting the same data differently. (A) Average responses and fits (sum of 2 Gauss functions) of the attend-fix and attend-in data from the 89 neurons included in this study. For the underlying data see S1 Data. Individual fitted tuning curves of both attentional conditions were averaged across the population. Stimulus directions relative to the neuron’s preferred (upward) direction are depicted along the upper x-axis. The curves can also be thought to represent the population response of idealized MT neurons differing only in their preferred direction (marked along the lower x-axis in panel B) to a single stimulus condition (encircled by black ellipse). The median adjusted R2 (Eq 5) across the cells for the attend-fix and attend-in conditions’ fits was 0.912 and 0.882, respectively. (B) Attentional modulation profile. The 12 data points are the average AIs computed across the population of neurons (see Fig 2B for AI of a single neuron; error bars are ±1 SEM). The left y-axis represents AIs, the right one shows the corresponding modulation ratios (%). The solid curve is the point-by-point modulation of the attend-in versus attend-fix population response profiles obtained by comparing the 2 fitted tuning profiles shown in panel A. (Inset) The cell-by-cell frequency distribution of AIs (attend-in versus attend-fix) for the predicted peak ratios: AI = (PRin − PRfix) ÷ (PRin + PRfix), where PR = PR ÷ PL are the ratios between the heights of the right and left fitted peaks in the respective attentional condition (these values are depicted in Fig 2B). For the relative peak responses separately for the 2 conditions, see S6 Fig. Note a strong (26%) overall attentional modulation of peak responses within our neuronal population. AI, attentional index; MT, middle temporal.
Fig 4
Fig 4. Conceptual models of attention and population fits.
The upper panels represent simulations of population responses to a bidirectional stimulus moving at ±60° relative to the upward direction in attend-fix and attend-in conditions, whereas the middle and lower panels depict the respective population activity fits plotted in the same format as in Fig 3; see S1 Data for the underlying data. (A) FSGM: attend-in profile is a result of multiplication of the sensory response by a monotonic function of the similarity between the attended direction and the cell’s preferred direction (black dashed line). Fits of the attend-in data by the 2 models of attention are based on the attend-fix fit from the 2-Gaussians model; the blue curves are the same as in Fig 3. The attentional gain peaks in a subpopulation preferring the cued direction (purple arrow) and reaches its minimal value in neurons for which the cued direction is antipreferred (trough of black dashed line). (B) eFSGM. The only difference between the A and B is the location of the peak gain, which may vary in eFSGM while it is constant (on-cue) in FSGM. The median adjusted R2 values for both models are provided in red font. The eFSGM, despite being a relatively simple model, fits the data as well as the over-parameterized SG (p = 0.115, balanced one-way ANOVA on the BIC values [Eq 7] with multiple comparison of 3 models), whereas the FSGM performs significantly worse than the SG (p = 0.0134). BIC, Bayesian information criterion; eFSGM, extended FSGM; FSGM, feature-similarity gain model; SG, sum of 2 Gaussians.
Fig 5
Fig 5. Example tuning curves of a single neuron fitted by the SG, FSGM, and eFSGM.
A single-cell example (C032-02+01) of attentional gain boosting the outer flank of the target peak. The layout of all panels is similar to that of Fig 2B. (A) Responses to bidirectional stimuli in the attend-fix and attend-in conditions: data points with error bars (1 SEM) and fits by the SG (Eq 4). The lower AI plot contains data points and the solid curve calculated (Eq 1) using the measured responses and fits from the upper plot, respectively. Note that this fit just describes the data but is not based on any conceptual model. (B) Fit by the FSGM; see Eq 8. The attend-fix fit from panel A (blue curve) is multiplied by a 2-free-parameters function with a maximum at the target feature (x0, vertical black dashed line) to fit the red data points. Note that this model in this case completely fails to reproduce the attentional modulation. (C) Fitting the red data points by the extended FSGM (Eq 9). The blue curve is multiplied by a linear function like in panel B but having a variable position of the maximum (ξ, red dashed line) different from the target feature x0 by an offset (shown by red arrow). The fits quality (AIC and adjusted R2 values; see Eqs 5 and 6) is provided on top of the respective panels. The underlying data can be found in S1 Data. AI, attentional index; eFSGM, extended FSGM; FSGM, feature-similarity gain model; SG, sum of Gaussians.
Fig 6
Fig 6. Cells clustering according to the alignment of FBA relative to the target feature estimated from the eFSGM fits.
(A) Frequency histogram depicting the data from 74 cells (of both animals). For every cell, the attentional offset was computed as a difference between the predicted peak of attentional gain and the neuron’s preferred direction. It is obvious that the data fall into 3 clusters, distinguished by the bar colors. The cluster centroids are marked by dashed vertical lines with the respective values on top of the histogram. The vector cartoons show the centroid direction relative to that of the target and the distractor (marked by letters T and D respectively)T and the D. (Inset) Behavioral correlate of the 3 clusters. Mean HRs and RTs are depicted together with error bars (1 SEM). Both parameters show a trend of improvement with alignments further away from the distractor. (B) The averaged within clusters activity profiles fitted by the eFSGM depicted in 3 columns under the respective clusters of panel A. The layout is same as of Fig 3, but the upper panels here depict average responses normalized across cells to the highest attend-fix data point of each cell. Note very different modulation effects between the clusters emphasized by the plots of attentional indices. The underlying data can be found in S1 Data.; eFSGM, extended FSGM; FBA, feature-based attention; HR, hit rate; RT, reaction time.

Similar articles

Cited by

References

    1. McMains SA, Fehd HM, Emmanouil TA, Kastner S. Mechanisms of feature- and space-based attention: response modulation and baseline increases. J Neurophysiol. 2007;98: 2110–21. 10.1152/jn.00538.2007 - DOI - PubMed
    1. Moran J, Desimone R. Selective attention gates visual processing in the extrastriate cortex. Science. 1985;229: 782–4. 10.1126/science.4023713 - DOI - PubMed
    1. Somers DC, Dale AM, Seiffert AE, Tootell RB. Functional MRI reveals spatially specific attentional modulation in human primary visual cortex. Proc Natl Acad Sci U A. 1999;96: 1663–8. - PMC - PubMed
    1. Treue S, Maunsell JH. Effects of attention on the processing of motion in macaque middle temporal and medial superior temporal visual cortical areas. J Neurosci. 1999;19: 7591–602. - PMC - PubMed
    1. McAdams CJ, Maunsell JH. Effects of attention on orientation-tuning functions of single neurons in macaque cortical area V4. J Neurosci. 1999;19: 431–41. - PMC - PubMed

Publication types