. 2019 Aug 6;14(8):e0203096.
doi: 10.1371/journal.pone.0203096. eCollection 2019.

Mindfulness meditators show altered distributions of early and late neural activity markers of attention in a response inhibition task

Affiliations

Mindfulness meditators show altered distributions of early and late neural activity markers of attention in a response inhibition task

Neil W Bailey et al. PLoS One. .

Abstract

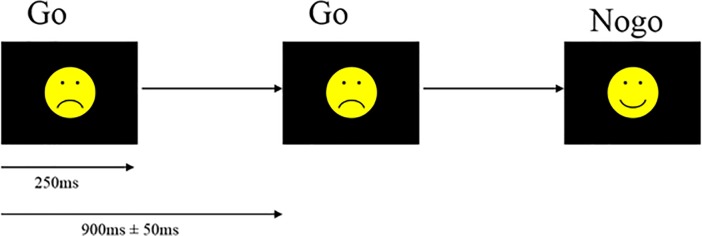
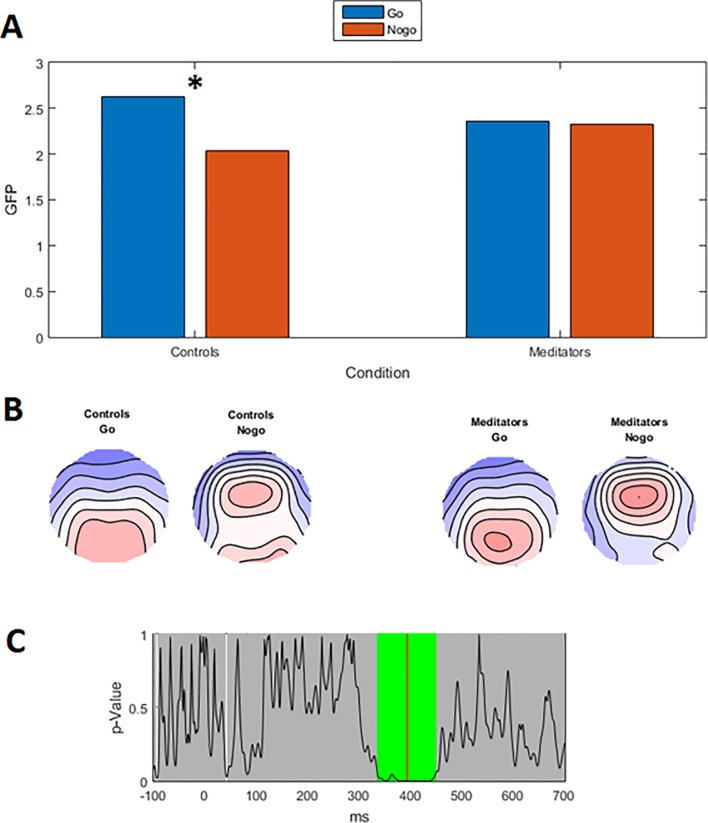
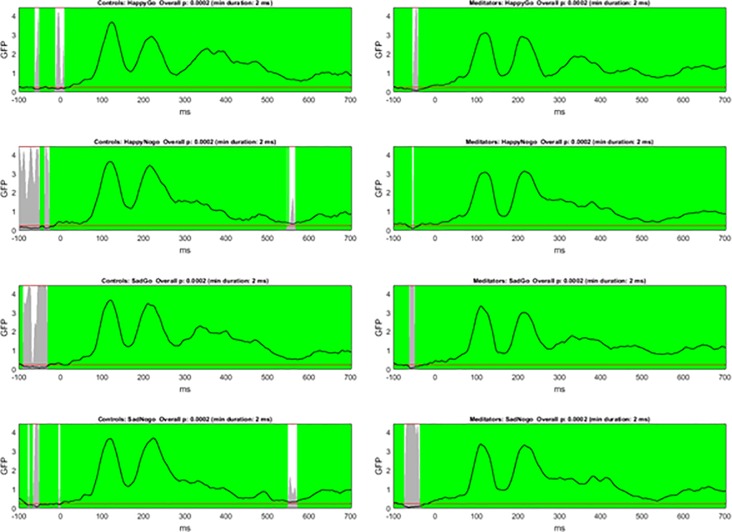
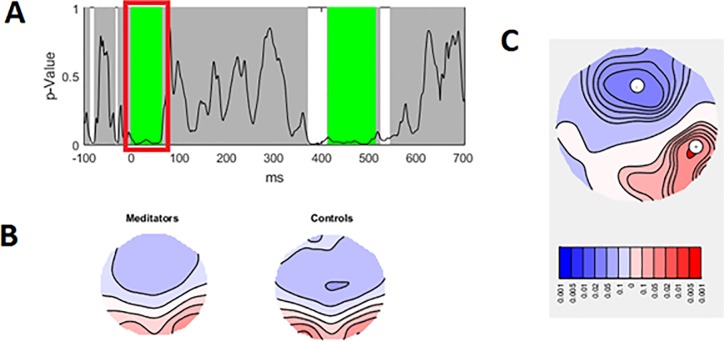
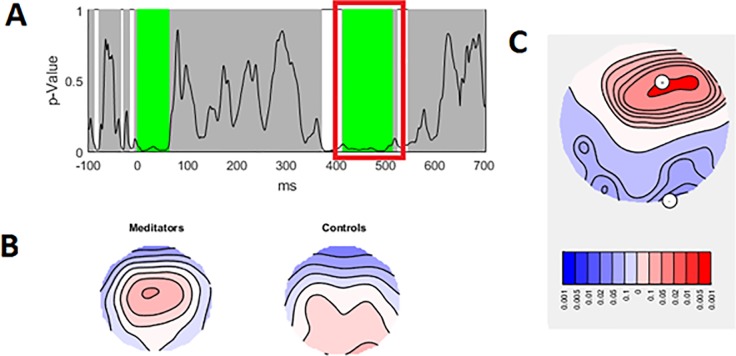
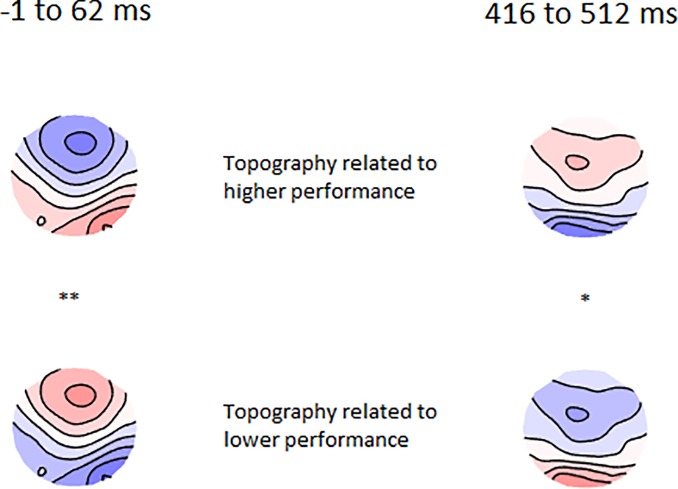
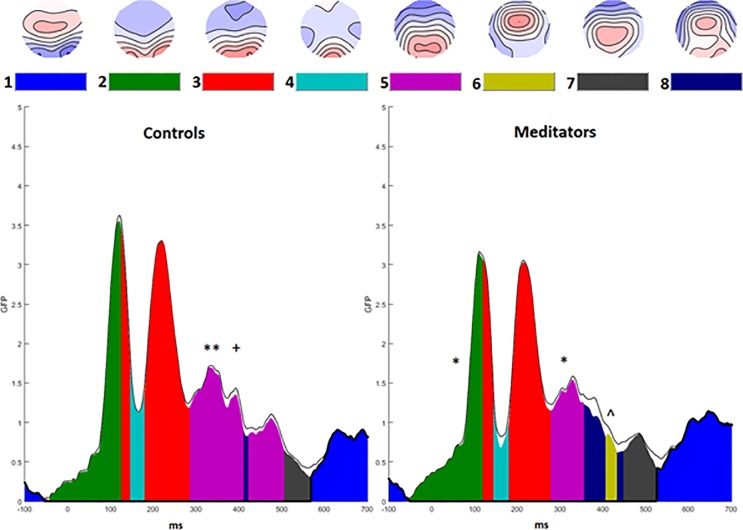
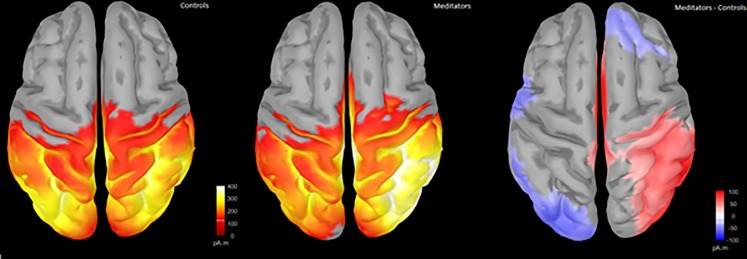
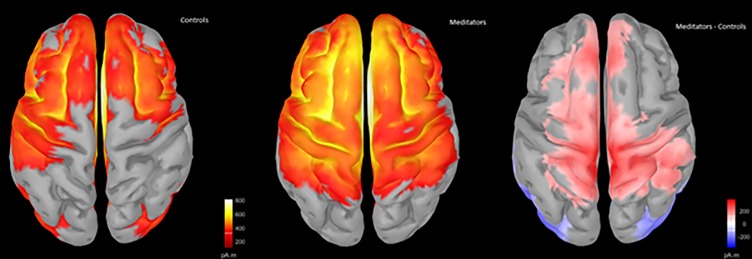
Attention is vital for optimal behavioural performance in every-day life. Mindfulness meditation has been shown to enhance attention. However, the components of attention altered by meditation and the related neural activities are underexplored. In particular, the contributions of inhibitory processes and sustained attention are not well understood. To address these points, 34 meditators were compared to 28 age and gender matched controls during electroencephalography (EEG) recordings of neural activity during a Go/Nogo response inhibition task. This task generates a P3 event related potential, which is related to response inhibition processes in Nogo trials, and attention processes across both trial types. Compared with controls, meditators were more accurate at responding to Go and Nogo trials. Meditators showed a more frontally distributed P3 to both Go and Nogo trials, suggesting more frontal involvement in sustained attention rather than activity specific to response inhibition. Unexpectedly, meditators also showed increased positivity over the right parietal cortex prior to visual information reaching the occipital cortex (during the pre-C1 window). Both results were positively related to increased accuracy across both groups. The results suggest that meditators show altered engagement of neural regions related to attention, including both higher order processes generated by frontal regions, and sensory anticipation processes generated by poster regions. This activity may reflect an increased capacity to modulate a range of neural processes in order to meet task requirements. This increased capacity may underlie the improved attentional function observed in mindfulness meditators.


Conflict of interest statement

PBF has received equipment for research from MagVenture A/S, Medtronic Ltd, Cervel Neurotech and Brainsway Ltd and funding for research from Neuronetics and Cervel Neurotech. PBF is on the scientific advisory board for Bionomics Ltd. All other authors have no conflicts to report. PBF is supported by a National Health and Medical Research Council of Australia Practitioner Fellowship (6069070). KEH is supported by a National Health and Medical Research Council of Australia Career Development Fellowship (1082894). NCR is supported by a National Health and Medical Research Council of Australia Fellowship (1072057). This does not alter our adherence to PLOS ONE policies on sharing data and materials.

Figures

Fig 1
Fig 1. Go/Nogo task design.
Go:Nogo ratio was 50:50, with stimulus response pairings switched in the second block so all participants responded to an equal number of happy and sad faces, and stimulus response pairings counter-balanced within each group.
Fig 2
Fig 2. Significant group by Go/Nogo GFP interaction during the P3 window.
A—Averaged GFP within the significant 336 ms to 449 ms window (green periods = 46 ms reflect periods that exceed the duration control for multiple comparisons across time = 33 ms). * p-uncorrected < 0.001 (FDR p < 0.004). B—Averaged topography during the significant window for each group. C–p-values of the group by Go/Nogo trial comparison for the real data against 5000 randomly shuffled permutations across the entire epoch.
Fig 3
Fig 3. Topographical consistency test.
The line indicates GFP values and the grey bars indicate p-values, with the red line indicating p = 0.05. White sections indicate regions without significantly consistent distribution of activity within the group/condition, while green periods indicate consistent distribution of activity across the group/condition after duration control for multiple comparisons across time [42]. Note significant consistency across all conditions for both groups except for prior to stimulus onset, and around 550 ms in the Nogo trials for control participants.
Fig 4
Fig 4. TANOVA main group effect from -1 to 62 ms.
A—p values of the between-group comparison for the real data against 5000 randomly shuffled permutations across the entire epoch (green periods reflect periods that exceed the duration control for multiple comparisons across time = 46 ms). B—Averaged topographical maps for each group during the significant time window. C—p-map for meditators topography minus control topography during the significant time window (p = 0.003 averaged across the significant window, partial eta squared effect size = 0.0720).
Fig 5
Fig 5. TANOVA main group effect from 416 to 512 ms.
A—p values of the between-group comparison for the real data against 5000 randomly shuffled permutations across the entire epoch (green periods reflect periods that exceed the duration control for multiple comparisons across time = 46 ms). B—Averaged topographical maps for each group during the significant time window. C—p-map for meditators topography minus control topography during the significant time window (p = 0.007 averaged across the significant window, partial eta squared effect size = 0.0657).
Fig 6
Fig 6. TANCOVA topographies depicting the relationship between cumulative percentage correct and averaged topography.
From -1 to 62 ms (left) and 416 to 512 ms (right) across both groups. * p = 0.048, ** p = 0.006.
Fig 7
Fig 7. Microstate analysis showing overall between-group effects.
Meditators differed in microstate 2 (reflecting pre-C1 activity), and microstates 5 and 6 (reflecting P3 activity). * p < 0.05 indicates an earlier centre of gravity in meditators, ** p < 0.01 indicates a longer duration in controls, + p < 0.05 indicates a larger area under the curve in controls, ^ p < 0.05 indicates larger area under the curve in meditators [66].
Fig 8
Fig 8. Source reconstruction during the -1 to 62 ms window using sLORETA and minimum norm imaging, unconstrained to cortex (to minimise assumptions).
Group averages do not depict positive or negative voltages, only where a region was activated. Difference maps reflect meditator minus control activity (red reflecting more activity in meditators compared to controls, blue reflecting less activity in meditators).
Fig 9
Fig 9. Source reconstruction during the 416 to 512 ms window using sLORETA and minimum norm imaging, unconstrained to cortex (to minimise assumptions).
Group averages do not depict positive or negative voltages, only where a region was activated. Difference maps reflect meditator minus control activity (red reflecting more activity in meditators compared to controls, blue reflecting less activity in meditators).

References

    1. Posner MI, Rothbart MK, Tang Y-Y. Enhancing attention through training. Current Opinion in Behavioral Sciences. 2015;4:1–5.
    1. Lavie N. Perceptual load as a necessary condition for selective attention. Journal of Experimental Psychology: Human perception and performance. 1995;21(3):451 - PubMed
    1. Lubbe RHVd Vogel RO, Postma A. Different effects of exogenous cues in a visual detection and discrimination task: delayed attention withdrawal and/or speeded motor inhibition? Journal of Cognitive Neuroscience. 2005;17(12):1829–40. 10.1162/089892905775008634 - DOI - PubMed
    1. Crane RS, Brewer J, Feldman C, Kabat-Zinn J, Santorelli S, Williams JMG, et al. What defines mindfulness-based programs? The warp and the weft. Psychological medicine. 2017;47(6):990–9. 10.1017/S0033291716003317 - DOI - PubMed
    1. Malinowski P. Neural mechanisms of attentional control in mindfulness meditation. Frontiers in neuroscience. 2013;7:8 10.3389/fnins.2013.00008 - DOI - PMC - PubMed

Publication types