

Patterns of nicotine concentrations in electronic cigarettes sold in the United States, 2013-2018
- PMID: 31386973
- PMCID: PMC6765364
- DOI: 10.1016/j.drugalcdep.2019.05.029
Patterns of nicotine concentrations in electronic cigarettes sold in the United States, 2013-2018
Abstract
Introduction: Considerable declines in cigarette smoking have occurred in the U.S. over the past half century. Yet emerging tobacco products, including e-cigarettes, have increased in popularity among U.S. youth and adults in recent years. Nicotine content is an important factor in weighing the potential benefits and risks of e-cigarettes on individual and population level health. This study examined how nicotine concentrations of e-cigarette products sold have changed from 2013 to 2018.
Methods: E-cigarette sales data aggregated in 4-week periods from March 2, 2013 to September 8, 2018 (66 months total) from convenience store and mass market channels were obtained from Nielsen. Internet and vape shop sales were not available. Internet searches were used to supplement information for nicotine concentration and flavor. Products were categorized by nicotine concentration, flavor, type (disposable or rechargeable), and brand. Dollar sales, unit sales, and average nicotine concentration were assessed.
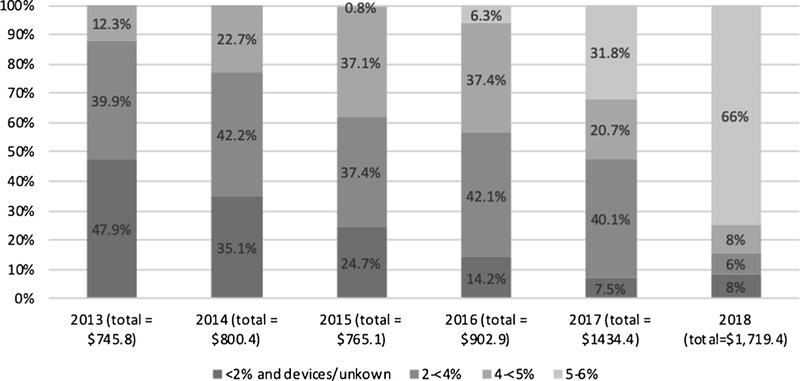
Results: During 2013-2018, the average nicotine concentration in e-cigarettes sold increased overall, for all flavor categories, and for rechargeable e-cigarettes. The proportion of total dollar sales comprised of higher nicotine concentration e-cigarettes (>4% mg/mL) increased from 12.3% to 74.7% during 2013-2018, with a similar increase in unit share. Zero-nicotine products accounted for less than 1% of dollar market share across all years analyzed.
Conclusions: E-cigarettes with higher nicotine concentrations comprise a substantial and increasing portion of U.S. e-cigarette sales. Higher nicotine concentrations may influence patterns of e-cigarette use, including harms from e-cigarette initiation among youth and potential health benefits for adult smokers switching completely to e-cigarettes.
Keywords: E-cigarettes; Flavors; Nielsen; Sales.
Copyright © 2019. Published by Elsevier B.V.
Conflict of interest statement
Declaration of Competing Interest
No conflict declared.
Figures
References
-
- American Nonsmokers’ Rights Foundation, 2018. States and Municipalities With Laws Regulating Use of Electronic Cigarettes As of July 1, 2018 Available from http://no-smoke.org/wp-content/uploads/pdf/ecigslaws.pdf Accessed August 10, 2018.
-
- Bowen A, Xing C, 2014. Nicotine Salt Formulations for Aerosol Devices and Methods Thereof Availabe from https://patents.google.com/patent/US9215895B2/en. Accessed July 7, 2019.
-
- Centers for Disease Control and Prevention, CDC, n.d. STATE System Available from: https://www.cdc.gov/STATESystem/. Accessed November 15, 2018.
Publication types
MeSH terms
Substances
Grants and funding
LinkOut - more resources
Full Text Sources
Medical
Miscellaneous
