. 2019 Aug 5;8(8):831.
doi: 10.3390/cells8080831.

Analysis of Tks4 Knockout Mice Suggests a Role for Tks4 in Adipose Tissue Homeostasis in the Context of Beigeing

Affiliations

Analysis of Tks4 Knockout Mice Suggests a Role for Tks4 in Adipose Tissue Homeostasis in the Context of Beigeing

Virag Vas et al. Cells. .

Abstract

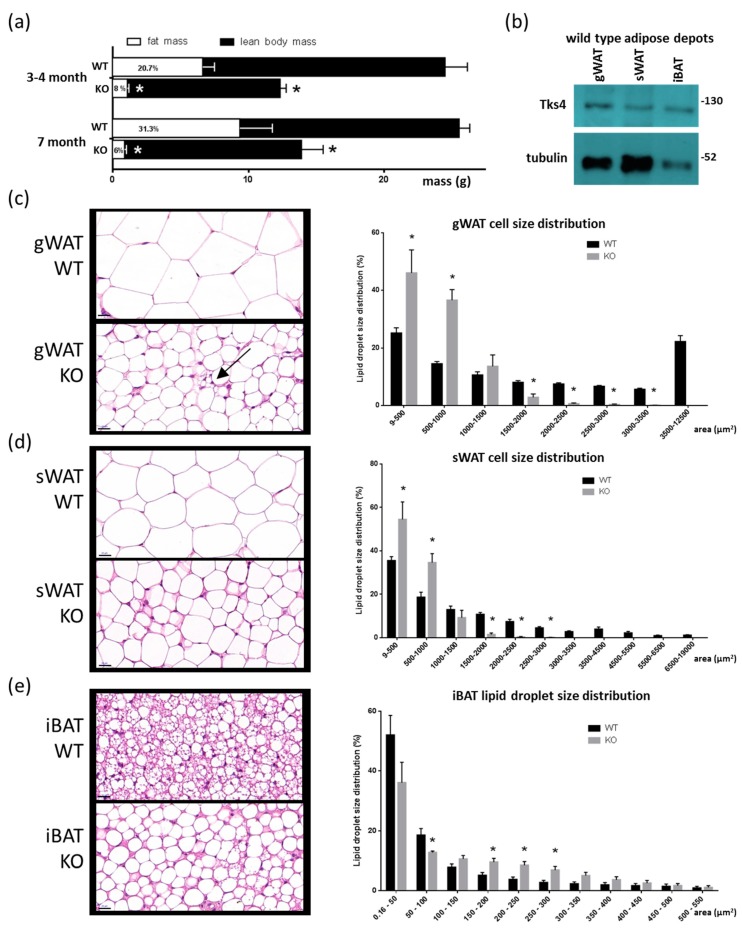
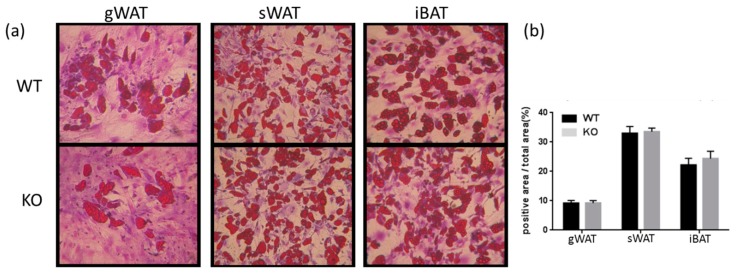
Obesity and adipocyte malfunction are related to and arise as consequences of disturbances in signaling pathways. Tyrosine kinase substrate with four Src homology 3 domains (Tks4) is a scaffold protein that establishes a platform for signaling cascade molecules during podosome formation and epidermal growth factor receptor (EGFR) signaling. Several lines of evidence have also suggested that Tks4 has a role in adipocyte biology; however, its roles in the various types of adipocytes at the cellular level and in transcriptional regulation have not been studied. Therefore, we hypothesized that Tks4 functions as an organizing molecule in signaling networks that regulate adipocyte homeostasis. Our aims were to study the white and brown adipose depots of Tks4 knockout (KO) mice using immunohistology and western blotting and to analyze gene expression changes regulated by the white, brown, and beige adipocyte-related transcription factors via a PCR array. Based on morphological differences in the Tks4-KO adipocytes and increased uncoupling protein 1 (UCP1) expression in the white adipose tissue (WAT) of Tks4-KO mice, we concluded that the beigeing process was more robust in the WAT of Tks4-KO mice compared to the wild-type animals. Furthermore, in the Tks4-KO WAT, the expression profile of peroxisome proliferator-activated receptor gamma (PPARγ)-regulated adipogenesis-related genes was shifted in favor of the appearance of beige-like cells. These results suggest that Tks4 and its downstream signaling partners are novel regulators of adipocyte functions and PPARγ-directed white to beige adipose tissue conversion.

Keywords: Tks4 scaffold protein; WAT browning; adipogenesis; beige adipocytes.


Conflict of interest statement

The authors declare no conflict of interest.

Figures

Figure 1
Figure 1
Adipogenic phenotypes of the Tks4-knockout (KO) mice. (a) Fat mass and lean body mass of 3–4- and 7-month-old wild-type (WT) and Tks4-KO mice as measured via EchoMRI. The numbers within the white columns indicate the normalized fat mass to body mass percentage. (b) Western blot-based detection of Tks4 in WT gonadal white adipose tissue (gWAT), subcutaneous WAT (sWAT), and interscapular brown adipose tissue (iBAT). Tubulin was used as the loading control. Representative hematoxylin and eosin (H & E)-stained (c) gWAT, (d) sWAT, and (e) iBAT sections from WT and Tks4-KO mice are shown on the left side. Scale bar: 20 μm. The arrow indicates a multilocular cell islet among the white adipocytes in the Tks4-KO gWAT. Lipid droplet sizes were quantified, and size distribution diagrams are presented on the right side. Sections of six WT and six Tks4-KO mice were used, and four different fields-of-view from each mouse were analyzed. All data are presented as the mean ± SEM, and t-tests were applied to test statistical significance. * indicates p < 0.05.
Figure 2
Figure 2
The adipogenic differentiation capacity of stromal vascular fraction (SVF) cells. (a) SVF cells isolated from gWAT, sWAT, and iBAT from WT and Tks4-KO mice were treated with adipogenic medium for 7 days and then stained with Oil Red O to visualize the lipid droplets and dimethyl methylene blue to stain the cytoplasm. Representative images (original magnification: 10×) and (b) quantification of the Oil Red O staining.
Figure 3
Figure 3
Adipogenic phenotypes of Tks4-KO mice. (a) Representative images of uncoupling protein 1 (UCP1)-stained gWAT, sWAT, and iBAT sections isolated from WT and Tks4-KO mice. Scale bar: 50 μm. (b) Quantification of the UCP1+ frequency. Sections from six WT and six Tks4-KO mice were analyzed, and four different fields-of-view from each tissue sample were included. All data are presented as the mean ± SEM, and t-tests were applied to test statistical significance. * indicates p < 0.05. (c) Western blot analysis of the UCP1 protein abundance in iBAT isolated from WT and Tks4-KO mice. Tubulin was used as the loading control. A representative blot of two WT and two Tks4-KO iBAT samples is shown. (d) Quantification of the UCP1 western blotting results for the iBAT samples isolated from four WT and four Tks4-KO mice from two independent experiments.
Figure 4
Figure 4
The effects of Tks4 loss on the expression levels of adipogenesis-related regulatory genes. (a) Scatter plot showing the up- and downregulation of the investigated gene set. Each dot represents the expression level of a given gene in WT gWAT (the x axis represents the WT ΔCT) and in Tks4-KO gWAT (the y axis represents the Tks4-KO ΔCT). The two black lines represent the threshold fold change cut-offs at ±1.5. The black lines demarcate the genes with unchanged expression levels (blue dots), and the red-labeled and green-labeled dots represent the up- and downregulated genes, respectively, in the Tks4-KO gWAT (see the gene list in Table S1). The relative expression levels of the genes belonging to the pro-adipogenic factor group (b), the anti-adipogenic factor group, (c) and the pro-brown factor group (d) are shown in separate plots. The blue circles highlight a cofactor (PPARγC1a) and a corepressor (Sirt1) of PPARγ. The expression levels of the genes marked with red circles were verified via western blotting and immunohistochemical (IHC) analysis. The mRNA levels measured in the WT samples were set to 1, and the fold changes in the gene expression levels in the Tks4-KO samples were calculated. (e) An interaction network of the differentially regulated genes. The black arrows represent activating relationships, and the blunt-end lines represent inhibitory relationships among the factors. The red arrow indicates PPARγ as the most highly connected node. (f) The relative gene expression levels of the PPARγ-targeted genes. The gene expression fold changes were calculated via the ΔΔCT method. (g) The adiponectin protein level was measured via western blotting to validate the change in the mRNA level detected on the array. The adiponectin protein level was measured in three WT and three Tks4-KO gWAT samples, and tubulin was used as the loading control.

Similar articles

Cited by

References

    1. López-Suárez A. Burden of cancer attributeable to obesity, type 2 diabetes and associated risk factors. Metabolism. 2019;92:136–146. doi: 10.1016/j.metabol.2018.10.013. - DOI - PubMed
    1. Babenko V., Babenko R., Gamieldien J., Markel A. FTO haplotyping under lines high obesity risk for European populations. BMC Med. Genom. 2019;12:46. doi: 10.1186/s12920-019-0491-x. - DOI - PMC - PubMed
    1. Kleinendorst L., Massink M.P.G., Cooiman M.I., Savas M., vanderBaan-Slootweg O.H., Roelants R.J., Janssen I.C.M., Meijers-Heijboer H.J., Knoers N.V.A.M., Ploosvan Amstel H.K., et al. Geneticobesity: Next-generations equencing results of 1230 patients with obesity. J. Med. Genet. 2018;55:578–586. doi: 10.1136/jmedgenet-2018-105315. - DOI - PubMed
    1. Rask-Andersen M., Karlsson T., Ek W.E., Johansson A. Genome-wide association study of body fat distribution identifies adiposity lociand sex-specific genetic effects. Nat. Commun. 2019;10:1–10. doi: 10.1038/s41467-018-08000-4. - DOI - PMC - PubMed
    1. Senese R., Cioffi F., DeMatteis R., Petito G., deLange P., Silvestri E., Lombardi A., Moreno M., Goglia F., Lanni A. 3,5 Diiodo-l-Thyronine (T₂) Promotes the Browning of White Adipose Tissue in High-Fat Diet-Induced Overweight Male Rats Housed at Thermoneutrality. Cells. 2019;8:256. doi: 10.3390/cells8030256. - DOI - PMC - PubMed

Publication types