. 2019 Aug 5;8(8):833.
doi: 10.3390/cells8080833.

CDDO-Me Selectively Attenuates CA1 Neuronal Death Induced by Status Epilepticus via Facilitating Mitochondrial Fission Independent of LONP1

Affiliations

CDDO-Me Selectively Attenuates CA1 Neuronal Death Induced by Status Epilepticus via Facilitating Mitochondrial Fission Independent of LONP1

Ji-Eun Kim et al. Cells. .

Abstract

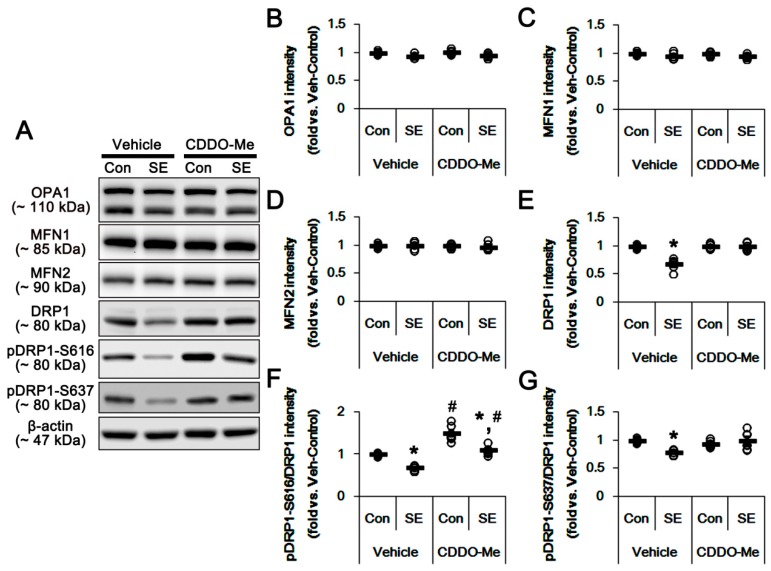
2-Cyano-3,12-dioxo-oleana-1,9(11)-dien-28-oic acid methyl ester (CDDO-Me) is a triterpenoid analogue of oleanolic acid that exhibits promising anti-cancer, anti-inflammatory, antioxidant and neuroprotective activities. In addition, CDDO-Me affects cellular differentiation and cell cycle arrest, and irreversibly inhibits Lon protease-1 (LONP1). In the present study, we evaluate the effects of CDDO-Me on mitochondrial dynamics and its downstream effectors in order to understand the underlying mechanism of the neuronal death following status epilepticus (SE, a prolonged seizure activity). CDDO-Me increased dynamin-related proteins 1 (DRP1)-serine 616 phosphorylation via activating extracellular-signal-regulated kinase 1/2 (ERK1/2) and c-Jun N-terminal kinase (JNK), but not protein kinase A (PKA) or protein phosphatases (PPs). In addition, CDDO-Me facilitated DRP1-mediated mitochondrial fissions, which selectively attenuated SE-induced CA1 neuronal death. Unlike CDDO-Me, LONP1 knockdown led to SE-induced massive degeneration of dentate granule cells, CA1 neurons and hilus interneurons without altering the expression and phosphorylation of DRP1, ERK1/2, JNK and PP2B. LONP1 knockdown could not inhibit SE-induced mitochondrial elongation in CA1 neurons. Co-treatment of CDDO-Me with LONP1 siRNA ameliorated only CA1 neuronal death, concomitant with abrogation of mitochondrial elongation induced by SE. Thus, our findings suggest that CDDO-Me may selectively attenuate SE-induced CA1 neuronal death by rescuing the abnormal mitochondrial machinery, independent of LONP1 activity.

Keywords: 4-HNE; DRP1; ERK1/2; JNK; PKA; TUNEL; hippocampus; mitochondrial dynamics; protein phosphatases.


Conflict of interest statement

The authors declare that the research was conducted in the absence of any commercial or financial relationships that could be construed as a potential conflict of interest.

Figures

Figure 1
Figure 1
Effects of 2-Cyano-3,12-dioxo-oleana-1,9(11)-dien-28-oic acid methyl ester (CDDO-Me) on Lon protease-1 (LONP1) expression, seizure activity and neuronal damage in response to pilocarpine. (AB) Effect of CDDO-Me on LONP1 expression in response to pilocarpine. Pilocarpine-induced status epilepticus (SE) increases LONP1 expression, which is not affected by CDDO-Me. (A) Representative western blots of LONP1 expression. (B) Quantification of LONP1 expression based on western blot data. Open circles indicate each individual value. Horizontal bars indicate mean value (mean ± S.E.M.; * p < 0.05 vs. control animals, respectively; n = 7). (CD) Effect of CDDO-Me on seizure activity in response to pilocarpine. CDDO-Me does not influence seizure activity induced by pilocarpine. (C) Representative electroencephalogram (EEG) traces and frequency-power spectral temporal maps in response to pilocarpine. (D) Quantification of total EEG power (seizure intensity) in response to pilocarpine. Open circles indicate each individual value. Horizontal bars indicate mean value (mean ± S.E.M.; n = 7, respectively). (EG) Effects of CDDO-Me on neuronal death and 4-hydroxy-2-nonenal (4-HNE) signals following SE. CDDO-Me mitigates CA1 neuronal damage, but not hilus interneurons, although it reduces 4-HNE signals in both neurons. (E) Representative photos of double immunofluorescent staining for terminal deoxynucleotidyl transferase dUTP nick end labeling (TUNEL) and 4-HNE. (F) Quantifications of the number of TUNEL positive neurons and (G) and the fluorescent intensity of 4-HNE in response to pilocarpine. Open circles indicate each individual value. Horizontal bars indicate mean value (mean ± S.E.M.; * p < 0.05 vs. vehicle; n = 7, respectively).
Figure 2
Figure 2
Effects of CDDO-Me on mitochondrial length and LONP1 expression in CA1 neurons. CDDO-Me reduces mitochondrial length in CA1 neurons of (A) control- and (B) post-SE animals. CDDO-Me does not affect the increased LONP1 expression following SE. (A,B) Representative photos of LONP1, mitochondria (Mito) and nuclei (DAPI) in CA1 neurons. (C,D) Quantifications of (C) the mitochondrial length and (D) LONP1 fluorescent intensity in CA1 neurons. Open circles indicate each individual value. Horizontal bars indicate mean value. Error bars indicate SEM (*,# p < 0.05 vs. vehicle and control animals, respectively; n = 7, respectively).
Figure 3
Figure 3
Effects of CDDO-Me on mitochondrial length and LONP1 expression in parvalbumin (PV) cells. CDDO-Me reduces mitochondrial length in CA1 neurons of (A) control- and (B) post-SE animals. CDDO-Me does not affect the increased LONP1 expression following SE. (A,B) Representative photos of LONP1, mitochondria (Mito) and PV. (C,D) Quantifications of (C) the mitochondrial length and (D) LONP1 fluorescent intensity in PV cells. Open circles indicate each individual value. Horizontal bars indicate mean value. Error bars indicate SEM (*,# p < 0.05 vs. vehicle and control animals, respectively; n = 7, respectively).
Figure 4
Figure 4
Effects of CDDO-Me on the expression and phosphorylation of mitochondrial dynamics-related molecules. CDDO-Me increases only the dynamin-related proteins 1 (DRP1)-S616 phosphorylation level under physiological- and post-SE conditions. (A) Representative images for western blots of optic atrophy 1 (OPA1), mitofusin 1 (MFN1), MFN2, DRP1, phospho (p)-DRP1-S616 and pDRP1-637 in the hippocampal tissues. (BG) Quantifications of OPA1, MFN1 and MFN2, DRP1, pDRP1-S616 and pDRP1-637 levels. Open circles indicate each individual value. Horizontal bars indicate mean value. Error bars indicate SEM (*,# p < 0.05 vs. control animals and vehicle, respectively; n = 7, respectively).
Figure 5
Figure 5
Effects of CDDO-Me on expressions and phosphorylations of extracellular-signal-regulated kinase 1/2 (ERK1/2), protein kinase A (PKA) and c-Jun N-terminal kinase (JNK). CDDO-Me increases ERK1/2 and JNK phosphorylation levels, but not PKA catalytic (PKA-Cat) and regulatory (PKA-Reg) subunits under physiological- and post-SE conditions. (A) Representative images for western blot of ERK1/2, phospho (p)-ERK1/2, PKA, pPKA, JNK and pJNK in the hippocampal tissues. (BG) Quantifications of ERK1/2, pERK1/2, PKA, pPKA, JNK and pJNK levels. Open circles indicate each individual value. Horizontal bars indicate mean value. Error bars indicate SEM (*,# p < 0.05 vs. control animals and vehicle, respectively; n = 7, respectively).
Figure 6
Figure 6
Effects of CDDO-Me on the expression and phosphorylation of protein phosphatase (PP) 1, PP2A and PP2B. CDDO-Me does not affect the expression and phosphorylation levels of protein phosphatase 1 (PP1), PP2A and PP2B under physiological- and post-SE conditions. (A) Representative images for western blot of PP1, phospho (p)-PP1, PP2A, pPP2A, PP2B and pPP2B in the hippocampal tissues. (BG) Quantifications of PP1, pPP1, PP2A, pPP2A, PP2B and pPP2B levels. Open circles indicate each individual value. Horizontal bars indicate mean value. Error bars indicate S.E.M. (* p < 0.05 vs. control animals; n = 7, respectively).
Figure 7
Figure 7
Effects of LONP1 siRNA on LONP1 expression, seizure activity and neuronal damage in response to pilocarpine. (A,B) Effect of LONP1 knockdown on LONP1 expression in response to pilocarpine. LONP1 siRNA effectively reduced LONP1 expression under physiological- and post-SE conditions. (A) Representative western blots of LONP1 expression. (B) Quantification of LONP1 expression based on western blot data. Open circles indicate each individual value. Horizontal bars indicate mean value (mean ± S.E.M.; * p < 0.05 vs. control animals, respectively; n = 7). (C,D) Effect of LONP1 knockdown on seizure activity in response to pilocarpine. LONP1 siRNA does not influence seizure activity induced by pilocarpine. (C) Representative EEG traces and frequency-power spectral temporal maps in response to pilocarpine. (D) Quantification of total EEG power (seizure intensity) in response to pilocarpine. Open circles indicate each individual value. Horizontal bars indicate mean value (mean ± S.E.M.; n = 7, respectively). (E,F) Effects of LONP1 siRNA and co-treatment of CDDO-Me on neuronal death induced by pilocarpine. LONP1 knockdown deteriorates degenerations of CA1 neurons, hilus interneurons (H) and dentate granule cells (DGC). Co-treatment of CDDO-Me attenuated CA1 neuronal death induced by SE. (E) Representative photos of FJB positive degenerating neurons. (F) Quantification of the number of FJB positive neurons in response to pilocarpine (mean ± S.E.M.; *,# p < 0.05 vs. control siRNA and LONP1 siRNA, respectively; n = 7, respectively).
Figure 8
Figure 8
Effects of LONP1 knockdown on expression/phosphorylation of DRP1, ERK1/2, JNK and PP2B, and mitochondrial length in CA1 neurons. LONP1 siRNA does not affect the expression and phosphorylation levels of DRP1, ERK1/2, JNK and PP2B under physiological- and post-SE conditions. In addition, LONP1 knockdown does not influence SE-induced mitochondrial elongation in CA1 neurons, although it reduces LONP1 expression. However, co-treatment of CDDO-Me ameliorates mitochondrial elongation. (A) Representative images for western blots of DRP1, phospho (p)-DRP1-S616, pDRP1-637, ERK1/2, pERK1/2, JNK, pJNK, PP2B and pPP2B in the hippocampal tissues. (BJ) Quantifications of DRP1, pDRP1-S616, pDRP1-637, ERK1/2, pERK1/2, JNK, pJNK, PP2B and pPP2B levels. Open circles indicate each individual value. Horizontal bars indicate mean value. Error bars indicate S.E.M. (* p < 0.05 vs. control animals; n = 7, respectively). (K) Representative photos of mitochondria (Mito) and LONP1 in CA1 neurons following SE. (L) Quantification of the mitochondrial length in CA1 neurons. Open circles indicate each individual value. Horizontal bars indicate mean value. Error bars indicate S.E.M. (*,# p < 0.05 vs. control siRNA and LONP1 siRNA, respectively; n = 7, respectively).

Similar articles

Cited by

References

    1. Trinka E., Cock H., Hesdorffer D., Rossetti A.O., Scheffer I.E., Shinnar S., Shorvon S., Lowenstein D.H. A definition and classification of status epilepticus—Report of the ILAE Task Force on Classification of Status Epilepticus. Epilepsia. 2015;56:1515–1523. doi: 10.1111/epi.13121. - DOI - PubMed
    1. Scharfman H.E. Epileptogenesis in the parahippocampal region. Parallels with the dentate gyrus. Ann. N. Y. Acad. Sci. USA. 2000;911:305–327. doi: 10.1111/j.1749-6632.2000.tb06734.x. - DOI - PubMed
    1. Cossart R., Bernard C., Ben-Ari Y. Multiple facets of GABAergic neurons and synapses: Multiple fates of GABA signalling in epilepsies. Trends. Neurosci. 2005;28:108–115. doi: 10.1016/j.tins.2004.11.011. - DOI - PubMed
    1. Ribak C.E., Dashtipour K. Neuroplasticity in the damaged dentate gyrus of the epileptic brain. Prog. Brain Res. 2005;136:319–328. - PubMed
    1. Tan Z., Sankar R., Shin D., Sun N., Liu H., Wasterlain C.G., Schreiber S.S. Differential induction of p53 in immature and adult rat brain following lithium-pilocarpine status epilepticus. Brain Res. 2002;928:187–193. doi: 10.1016/S0006-8993(01)03359-5. - DOI - PubMed

Publication types