. 2019 Aug 30;16(157):20190246.
doi: 10.1098/rsif.2019.0246. Epub 2019 Aug 7.

Adaptive integrate-and-fire model reproduces the dynamics of olfactory receptor neuron responses in a moth

Affiliations

Adaptive integrate-and-fire model reproduces the dynamics of olfactory receptor neuron responses in a moth

Marie Levakova et al. J R Soc Interface. .

Abstract

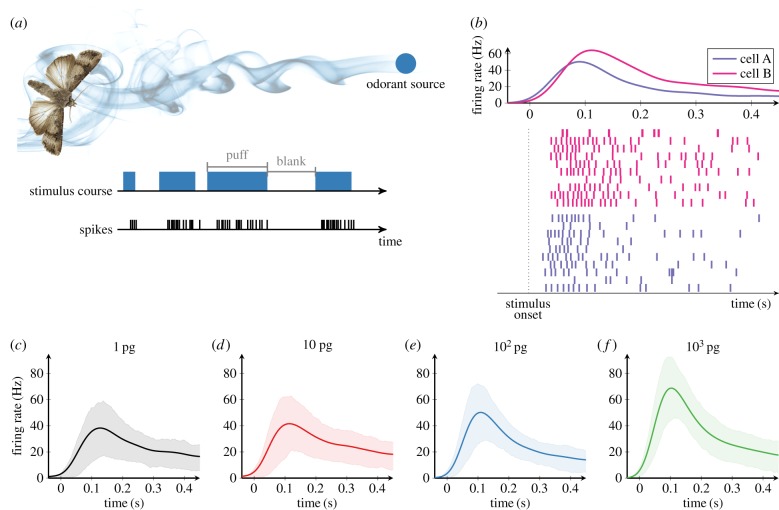
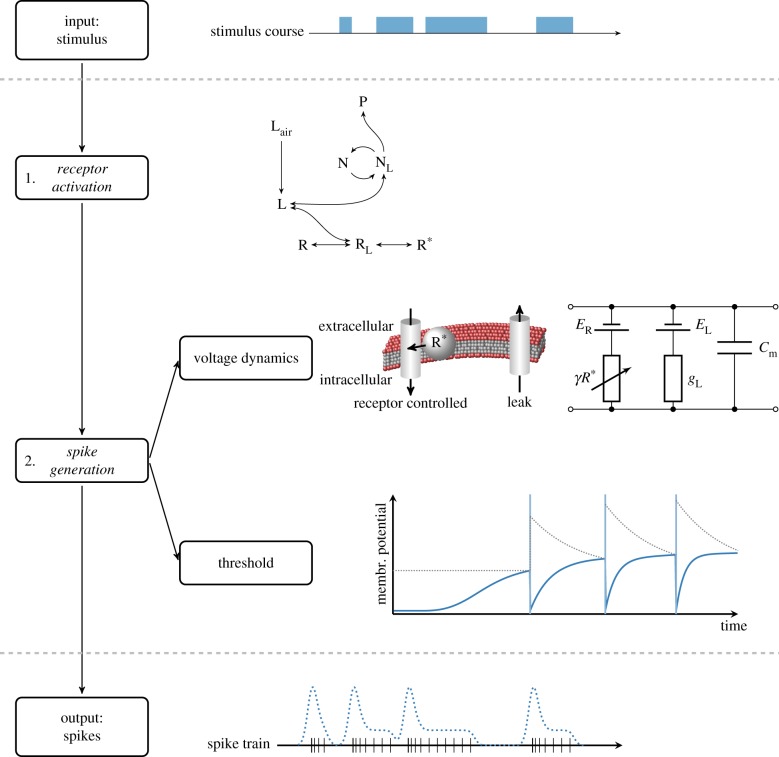
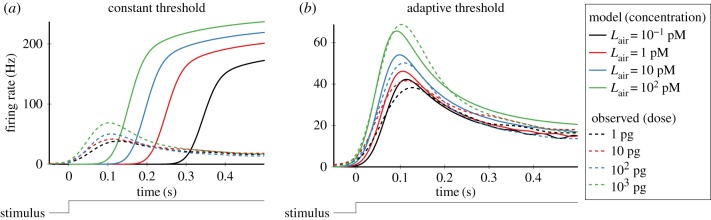
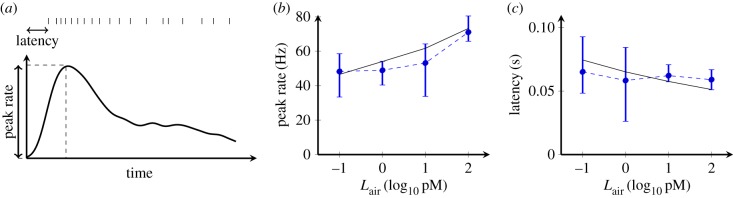
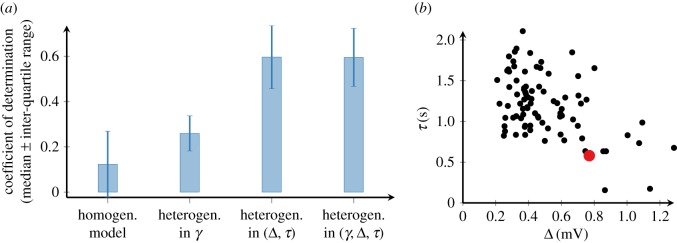
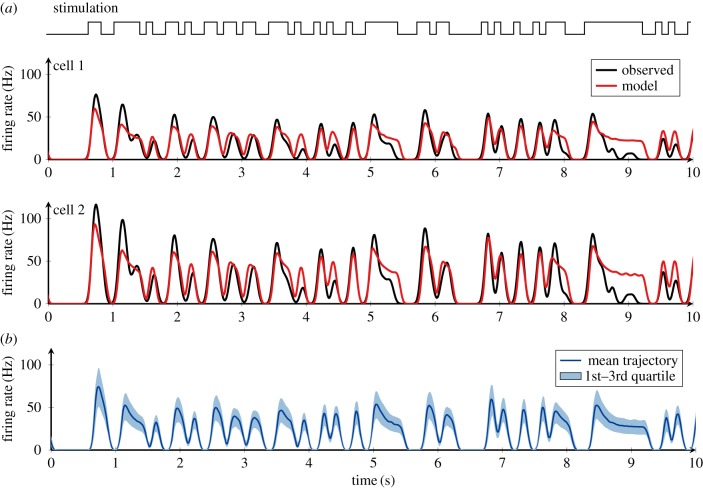
In order to understand how olfactory stimuli are encoded and processed in the brain, it is important to build a computational model for olfactory receptor neurons (ORNs). Here, we present a simple and reliable mathematical model of a moth ORN generating spikes. The model incorporates a simplified description of the chemical kinetics leading to olfactory receptor activation and action potential generation. We show that an adaptive spike threshold regulated by prior spike history is an effective mechanism for reproducing the typical phasic-tonic time course of ORN responses. Our model reproduces the response dynamics of individual neurons to a fluctuating stimulus that approximates odorant fluctuations in nature. The parameters of the spike threshold are essential for reproducing the response heterogeneity in ORNs. The model provides a valuable tool for efficient simulations of olfactory circuits.

Keywords: adaptive threshold; integrate-and-fire model; olfactory receptor neuron.


Conflict of interest statement

We declare we have no competing interests.

Figures

Figure 1.
Figure 1.
Experimental data for the responses of olfactory receptor neurons (ORNs) to pheromone stimulation. (a) ORNs were stimulated by intermittent delivery of the sex pheromone (four pheromone doses ranging from 1 to 1000 pg) to mimic fluctuating odorant concentration in a pheromone plume. (b) Examples of spike trains generated by two ORNs (cells A and B) in response to 0.5 s of constant pheromone stimulation at 100 pg. Top: The average firing rate of each cell. Bottom: Raster plots of 10 trials (rows) from each cell. Note the heterogeneity in firing rates between the two ORNs despite stimulation by the same pheromone pulse. (cf) The average firing rate across cells in response to the same 0.5 s pulse stimulus of pheromone at different doses (1–1000 pg). The shaded area represents the range between the lower and upper quartile trajectory. (Online version in colour.)
Figure 2.
Figure 2.
Proposed model of an olfactory receptor neuron (ORN). Stimulus. The odorant concentration fluctuating in time is the input to the model neuron. (1) Receptor activation. The odorant molecules in the air Lair are adsorbed in the lymph at the receptor site. The adsorbed molecules L either bind to receptors R resulting in activated receptors R* or they are degraded by an enzyme N, which converts them into an inactive product P. (2) Spike generation. Activated receptors R* induce a receptor current in a single-compartment model. The model neuron generates action potentials when the membrane potential reaches a threshold θ(t). Note that a time-dependent spike threshold model (dotted) can reproduce experimentally observed ORN responses. Response. The model provides spike times from which the firing rate can be calculated. (Online version in colour.)
Figure 3.
Figure 3.
Model with an adaptive spike threshold can reproduce the phasic–tonic response of ORNs to a pulse odorant stimulation. Average responses of ORNs (dashed lines) were compared with the responses of the model neurons (solid lines), i.e. the model with a constant threshold (a) and the model with an adaptive threshold (b). The unit receptor conductance was γ = 41 nS · μM−1 in (a) and γ = 99 nS · μM−1 in (b). Each spike generated by the model with a constant threshold (a) was followed by a 3 ms refractory period. The pheromone concentration in the air, Lair, was set to 0.1 pM, 1 pM, 10 pM, 100 pM for the pheromone doses 1 pg, 10 pg, 100 pg, 1000 pg, respectively. See tables 1 and 2 for the other parameters. (Online version in colour.)
Figure 4.
Figure 4.
Model with an adaptive spike threshold can reproduce the odorant response characteristics of ORNs. (a) A scheme illustrating two salient characteristics of the response time course: the peak firing rate and the first-spike latency. (b,c) The effect of odorant concentration on the response characteristics. The peak firing rate (b) and the first-spike latency (c) obtained from experimental data (dashed blue, mean with inter-quartile range) were compared with those obtained from the model (solid black). (Online version in colour.)
Figure 5.
Figure 5.
Heterogeneity in ORN model parameters. (a) Prediction performance of the model with all parameters fixed (homogeneous model) and three models with heterogeneous parameters (heterogeneity in γ, heterogeneity in (Δ, τ) and heterogeneity in (γ, Δ, τ)). (b) Scatter plot of the threshold parameters (Δ and τ) adjusted to individual neurons. The red dot represents the parameters fitted to the average ORN response (table 2). (Online version in colour.)
Figure 6.
Figure 6.
Fit of the model with an adaptive spike threshold to individual ORN responses. (a) Top: Time course of the pheromone stimulus. The stimulus was switching between ON and OFF states. In the ON state, the pheromone dose was 100 pg. Bottom: Firing rate time courses of two neurons (cells 1 and 2) obtained from experiments (black) and those of the model with individually tuned threshold parameters (red). (b) The distribution of firing rates of the model neurons whose threshold parameters were derived from 84 ORNs. The dark blue line represents the mean trajectory and the light blue area represents the range between the first and the third quartile. The individual trajectories vary only in the amplitude of the fluctuations, not in the temporal pattern. (Online version in colour.)

Similar articles

Cited by

References

    1. Hildebrand JG, Shepherd GM. 1997. Mechanisms of olfactory discrimination: converging evidence for common principles across phyla. Annu. Rev. Neurosci. 20, 595–631. (10.1146/annurev.neuro.20.1.595) - DOI - PubMed
    1. Wilson RI, Mainen ZF. 2006. Early events in olfactory processing. Annu. Rev. Neurosci. 29, 163–201. (10.1146/annurev.neuro.29.051605.112950) - DOI - PubMed
    1. Lánský P, Rospars J-P. 1998. Odorant concentration and receptor potential in olfactory sensory neurons. BioSystems 48, 131–138. (10.1016/S0303-2647(98)00058-6) - DOI - PubMed
    1. Lindemann B. 2001. Predicted profiles of ion concentrations in olfactory cilia in the steady state. Biophys. J. 80, 1712–1721. (10.1016/S0006-3495(01)76142-5) - DOI - PMC - PubMed
    1. Suzuki N, Takahata M, Sato K. 2002. Oscillatory current responses of olfactory receptor neurons to odorants and computer simulation based on a cyclic AMP transduction model. Chem. Senses 27, 789–801. (10.1093/chemse/27.9.789) - DOI - PubMed

Publication types

Substances

LinkOut - more resources