. 2019 Aug 6;20(1):634.
doi: 10.1186/s12864-019-5998-1.

Screening populations for copy number variation using genotyping-by-sequencing: a proof of concept using soybean fast neutron mutants

Affiliations

Screening populations for copy number variation using genotyping-by-sequencing: a proof of concept using soybean fast neutron mutants

Marc-André Lemay et al. BMC Genomics. .

Abstract

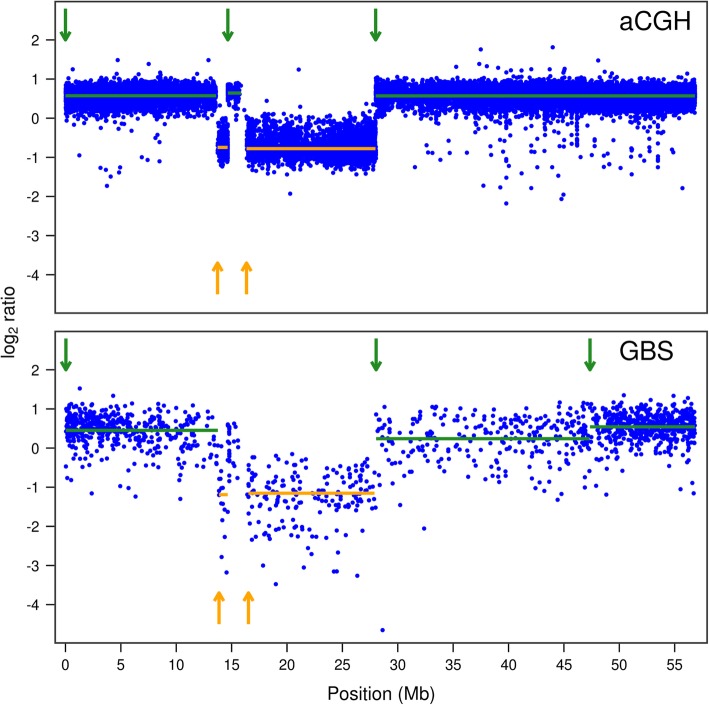
Background: The effective use of mutant populations for reverse genetic screens relies on the population-wide characterization of the induced mutations. Genome- and population-wide characterization of the mutations found in fast neutron populations has been hindered, however, by the wide range of mutations generated and the lack of affordable technologies to detect DNA sequence changes. In this study, we therefore aimed to test whether genotyping-by-sequencing (GBS) technology could be used to characterize copy number variation (CNV) induced by fast neutrons in a soybean mutant population.

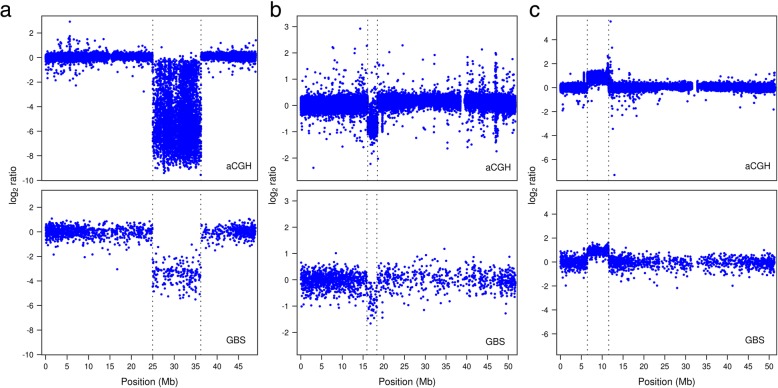
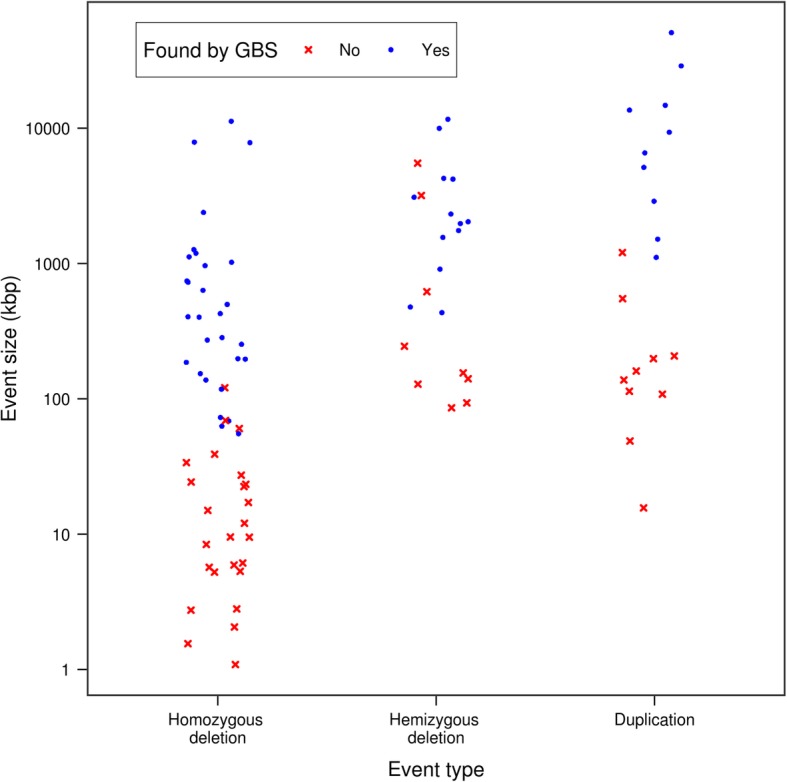
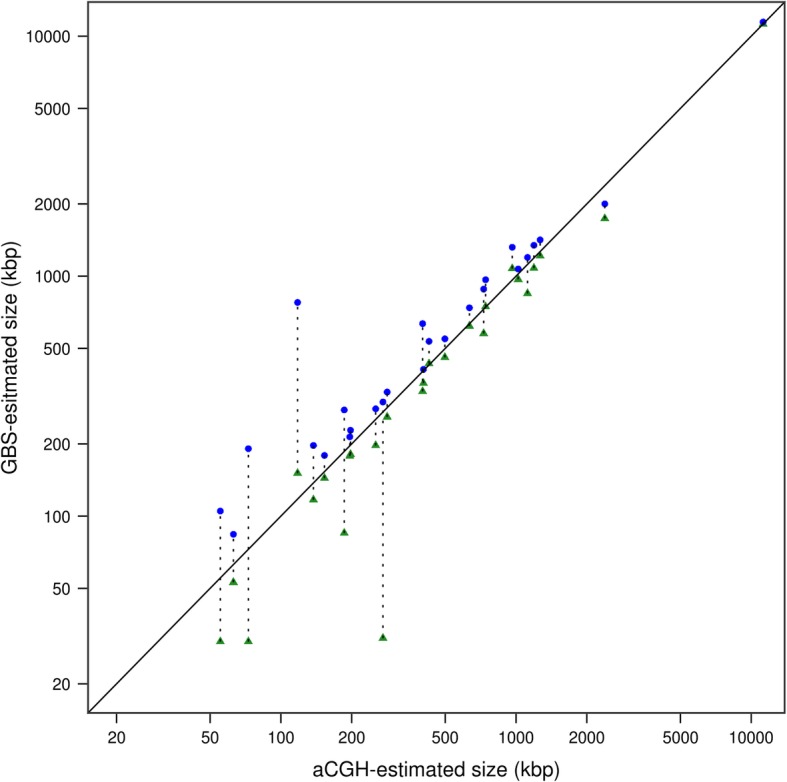
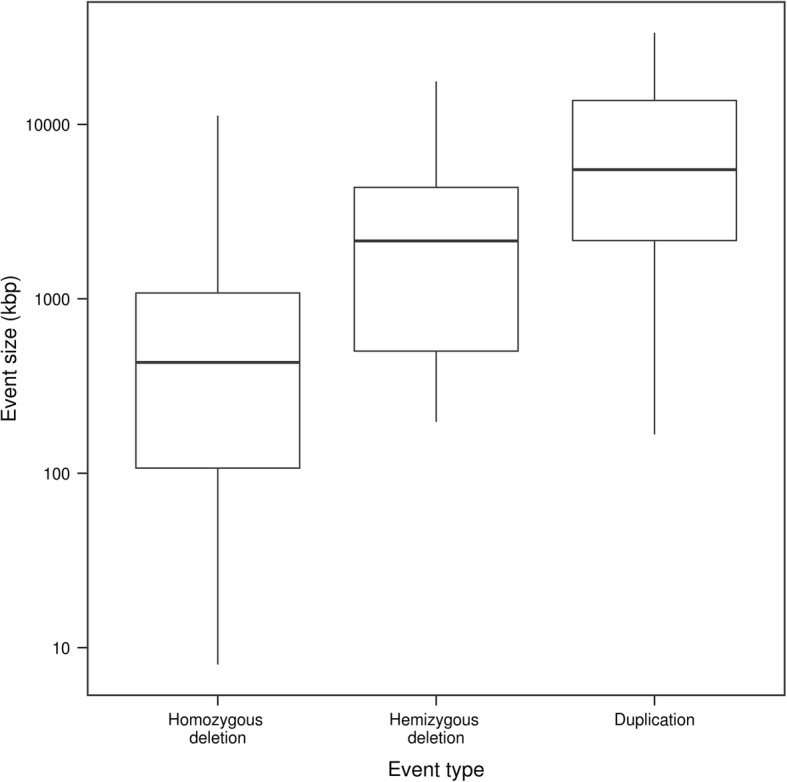
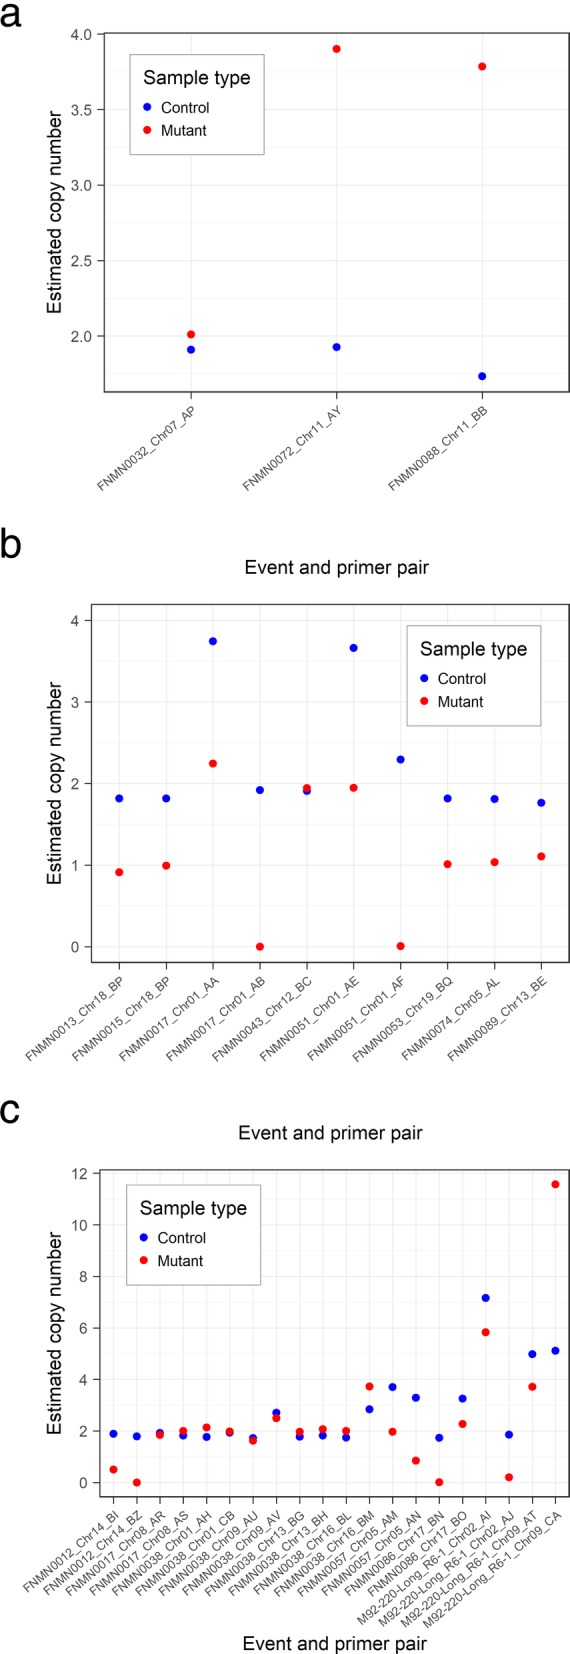
Results: We called CNVs from GBS data in 79 soybean mutants and assessed the sensitivity and precision of this approach by validating our results against array comparative genomic hybridization (aCGH) data for 19 of these mutants as well as targeted PCR and ddPCR assays for a representative subset of the smallest events detected by GBS. Our GBS pipeline detected 55 of the 96 events found by aCGH, with approximate detection thresholds of 60 kb, 500 kb and 1 Mb for homozygous deletions, hemizygous deletions and duplications, respectively. Among the whole set of 79 mutants, the GBS data revealed 105 homozygous deletions, 32 hemizygous deletions and 19 duplications. This included several extremely large events, exhibiting maximum sizes of ~ 11.2 Mb for a homozygous deletion, ~ 11.6 Mb for a hemizygous deletion, and ~ 50 Mb for a duplication.

Conclusions: This study provides a proof of concept that GBS can be used as an affordable high-throughput method for assessing CNVs in fast neutron mutants. The modularity of this GBS approach allows combining as many different libraries or sequencing runs as is necessary for reaching the goals of a particular study. This method should enable the low-cost genome-wide characterization of hundreds to thousands of individuals in fast neutron mutant populations or any population with large genomic deletions and duplications.

Keywords: Comparative genomic hybridization; Copy number variation; Crop genetics; Fast neutron-induced mutagenesis; Functional genomics; Genotyping-by-sequencing; Glycine max; Intra-cultivar heterogeneity; Reverse genetic screen; Soybean genetics.


Conflict of interest statement

The authors declare that they have no competing interests.

Figures

Fig. 1
Fig. 1
Examples of aCGH and GBS log2 ratio profiles of events detected using both methods. Vertical dotted lines mark event boundaries. The GBS log2 ratio data are those generated from the dataset used to called homozygous deletions and duplications from the first GBS library in all three cases. a log2 ratio profiles of a 11.2-Mb homozygous deletion on chromosome 14 of individual FNMN0065. b log2 ratio profiles of a 2.3-Mb hemizygous deletion on chromosome 15 of individual FNMN0039. c log2 ratio profiles of a 5.1-Mb duplication on chromosome 6 of FNMN0085. aCGH data also revealed a 50-kb duplication at around 5.6 Mb on this same chromosome; its visual signature can be seen on the GBS profile although it was not called by the automated pipeline
Fig. 2
Fig. 2
Size distribution of CNVs detected based on the aCGH data according to whether (blue dots) or not (red crosses) the GBS protocol and pipeline for calling CNVs detected them. The sizes plotted are those determined from the aCGH data. Points were jittered along the x-axis to avoid overlap between events of similar sizes. Note that the scale of the y-axis is logarithmic
Fig. 3
Fig. 3
Comparison of the sizes of homozygous deletions as estimated from aCGH and GBS approaches. For a given GBS deletion, the minimum deletion span (green triangles) and the maximum deletion span (blue dots) are linked by a dotted line. The solid diagonal line marks the equality line on which all points should ideally lie. Note that the scales of both axes are logarithmic
Fig. 4
Fig. 4
Size distribution of the events called from the data of the first GBS library among 79 fast neutron-mutagenized soybean lines. The event size plotted is the minimum span as estimated from the CNV-calling pipeline and is therefore likely an underestimation of the true event size. n = 97 for homozygous deletions, n = 30 for hemizygous deletions, and n = 17 for duplications. Note that the scale of the y-axis is logarithmic
Fig. 5
Fig. 5
aCGH and GBS log2 ratio profiles showing an unusual succession of events on chromosome 1 of individual FNMN0066. Duplications and hemizygous deletions are indicated in green (top arrows) and orange (bottom arrows) respectively. Arrows indicate the starting points of the events and solid horizontal lines indicate the span (x-axis) and mean log2 ratio (y-axis) of the segment. Note that the automated GBS approach missed the middle duplication around position 15 Mb and split the last duplication into two separate events. Both datasets, however, outline the same series of duplications and hemizygous deletions
Fig. 6
Fig. 6
Copy number of target regions in control and mutant samples as estimated by ddPCR for putative (a) duplications, (b) hemizygous deletions and (c) homozygous deletions. Estimated copy number was calculated by dividing the concentration (in number of DNA templates per μl) obtained for the primer pair considered by the concentration obtained for the reference BY primer pair in the same sample, times two (considering diploidy). X-axis labels include the name of the mutant sample in which the event was called, the chromosome on which the event is located, and the primer pair used to assess the number of copies (see Additional file 7 for primer information). The putative duplication in FNMN0044 and the putative homozygous deletion on chromosome 6 of FNMN0064 were omitted from these graphs because of their very high copy number (> 20)

References

    1. Beadle GW, Tatum EL. Genetic control of biochemical reactions in Neurospora. Proc Natl Acad Sci U S A. 1941;27:499–506. doi: 10.1073/pnas.27.11.499. - DOI - PMC - PubMed
    1. Hartwell LH, Culotti J, Pringle JR, Reid BJ. Genetic control of the cell division cycle in yeast. Science. 1974;183:46–51. doi: 10.1126/science.183.4120.46. - DOI - PubMed
    1. Horvitz HR, Sulston JE. Isolation and genetic characterization of cell-lineage mutants of the nematode Caenorhabditis elegans. Genetics. 1980;96:435–454. - PMC - PubMed
    1. Nüsslein-Volhard C, Wieschaus E. Mutations affecting segment number and polarity in Drosophila. Nature. 1980;287:795–801. doi: 10.1038/287795a0. - DOI - PubMed
    1. Waugh R, Leader DJ, McCallum N, Caldwell D. Harvesting the potential of induced biological diversity. Trends Plant Sci. 2006;11:71–79. doi: 10.1016/j.tplants.2005.12.007. - DOI - PubMed

LinkOut - more resources