. 2019 Aug 26;6(4):ENEURO.0022-19.2019.
doi: 10.1523/ENEURO.0022-19.2019. Print 2019 Jul/Aug.

Transcriptomic Signatures of Postnatal and Adult Intrinsically Photosensitive Ganglion Cells

Affiliations

Transcriptomic Signatures of Postnatal and Adult Intrinsically Photosensitive Ganglion Cells

Daniel J Berg et al. eNeuro. .

Abstract

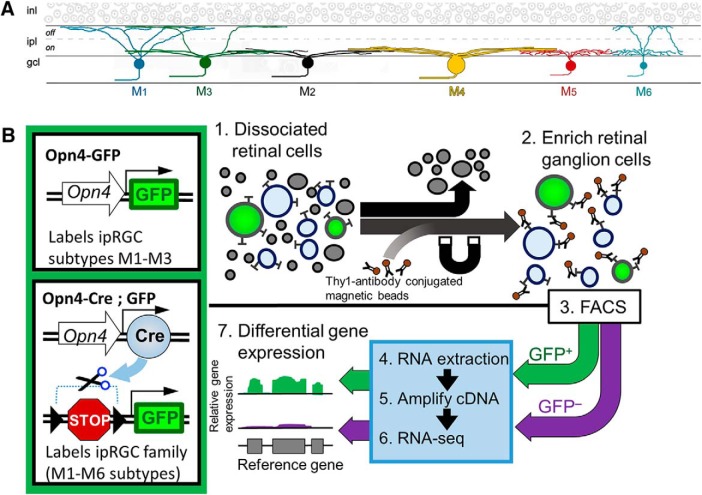
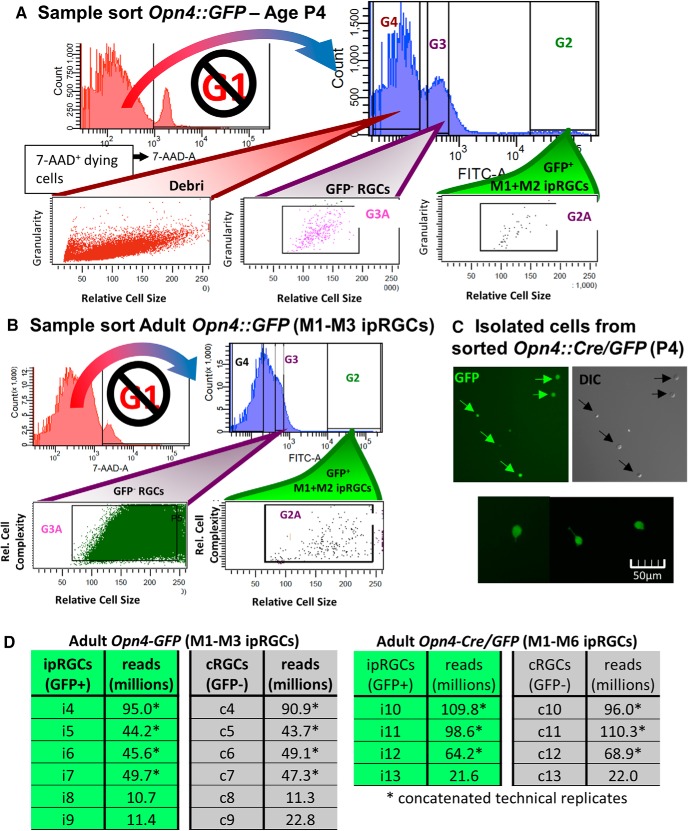
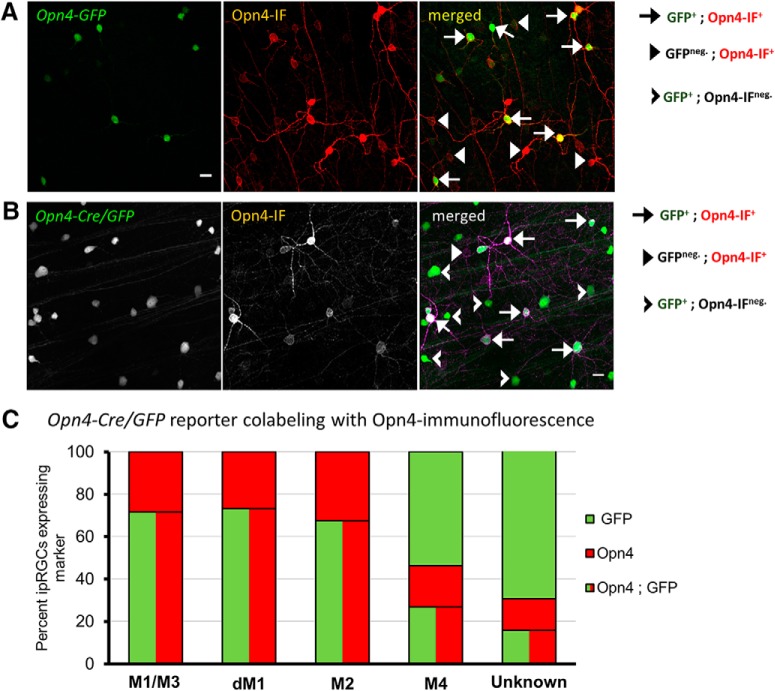
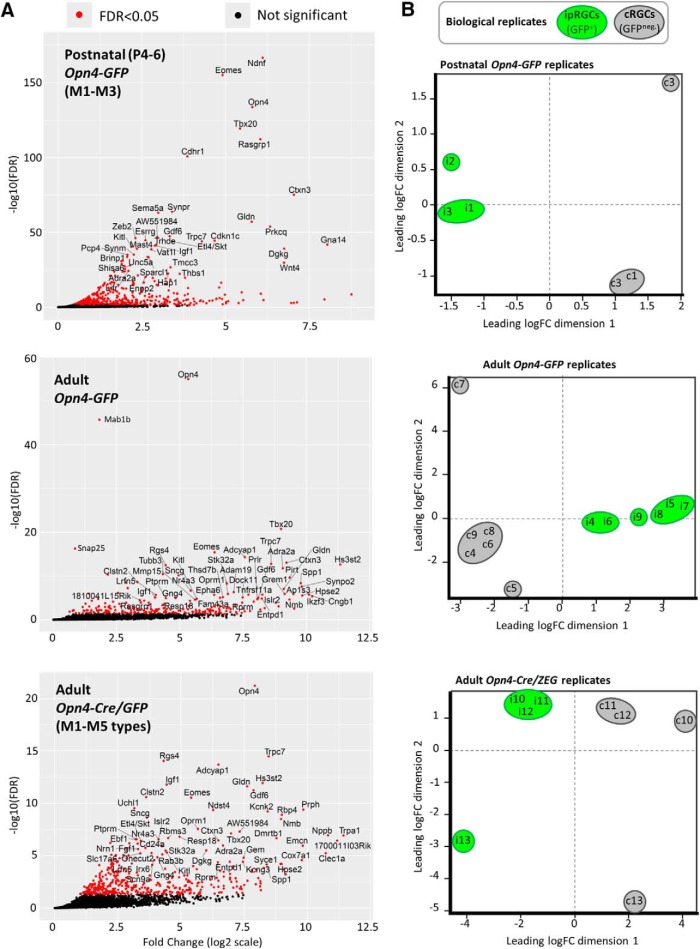
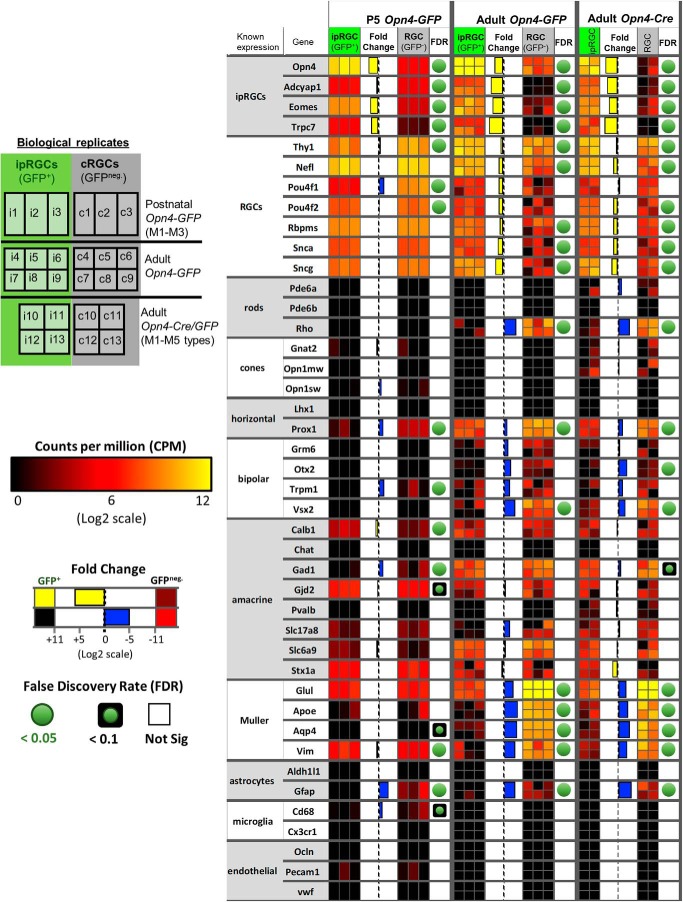
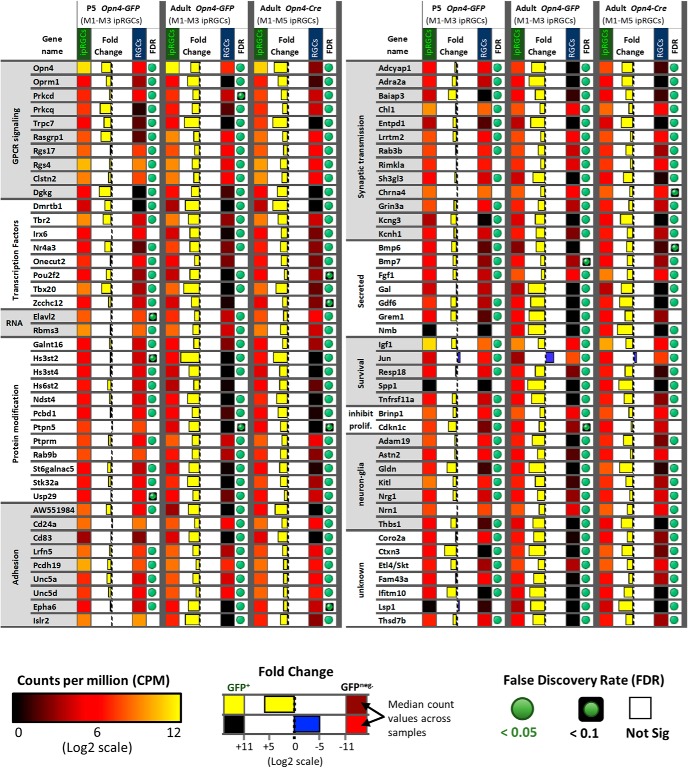
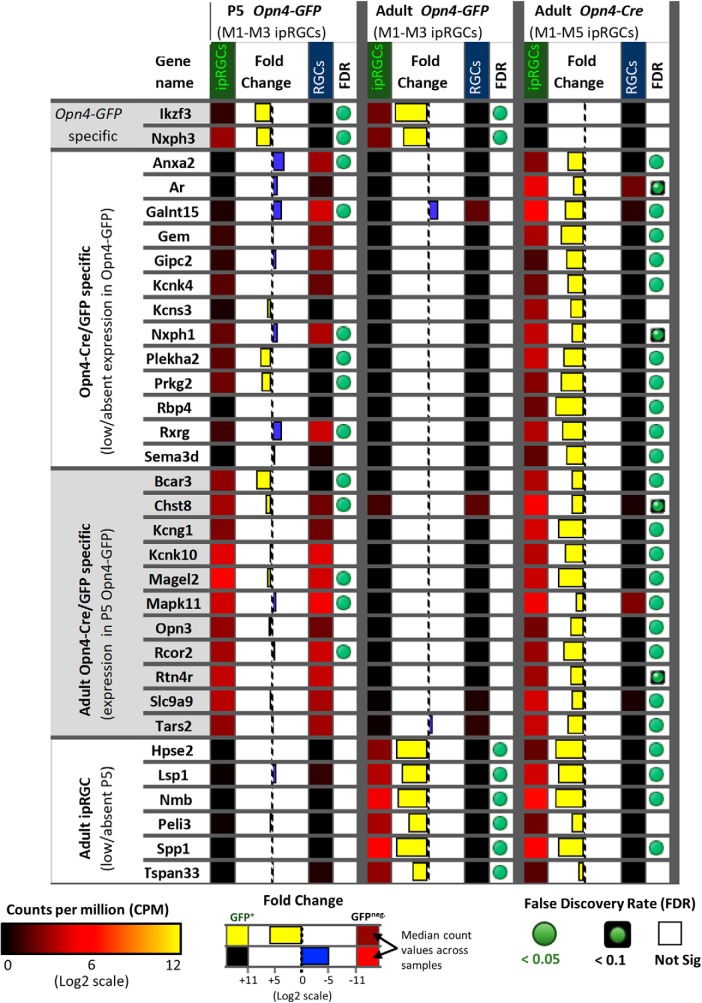
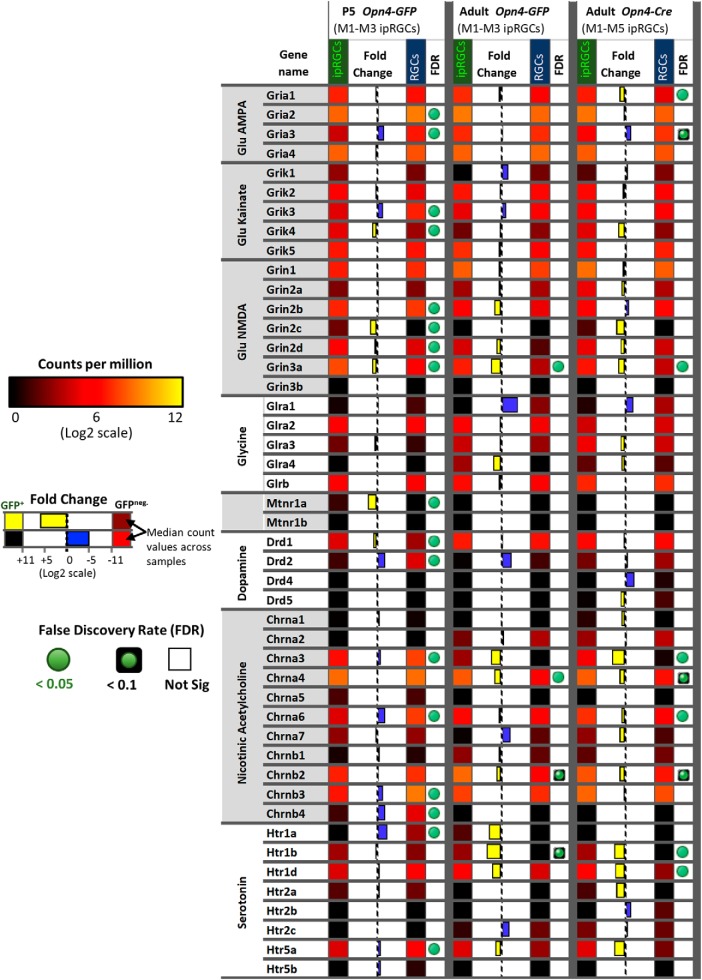
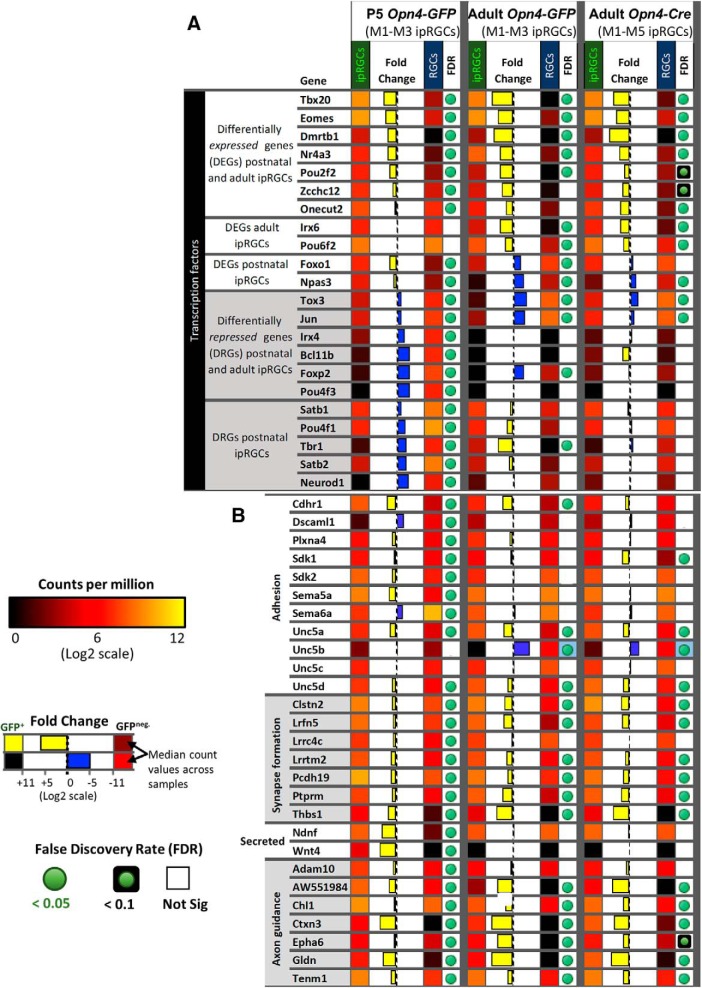
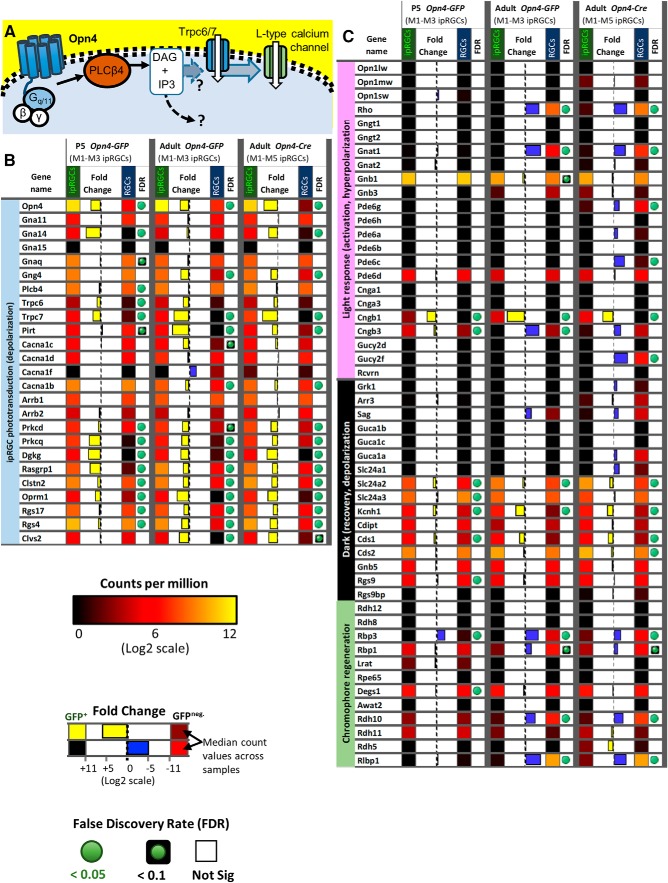
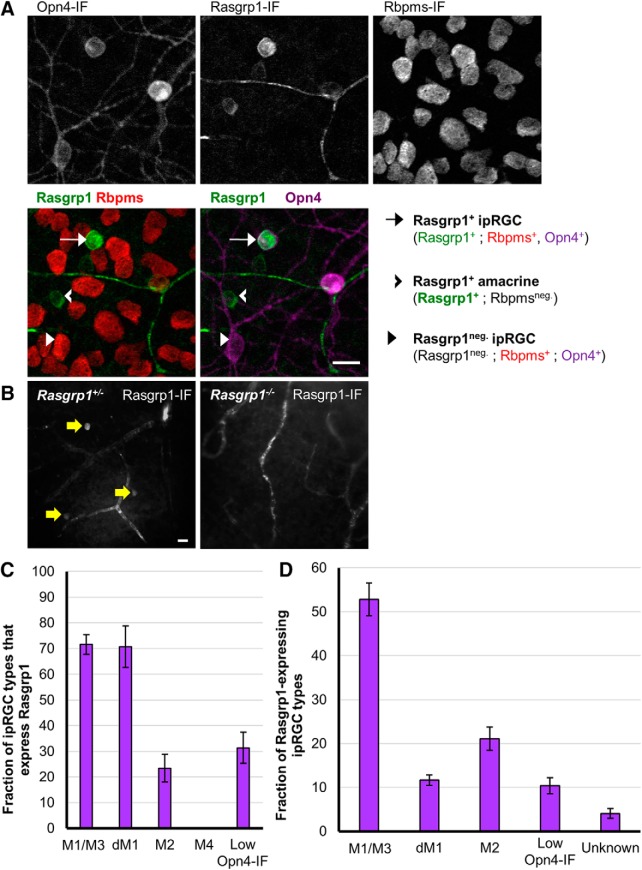
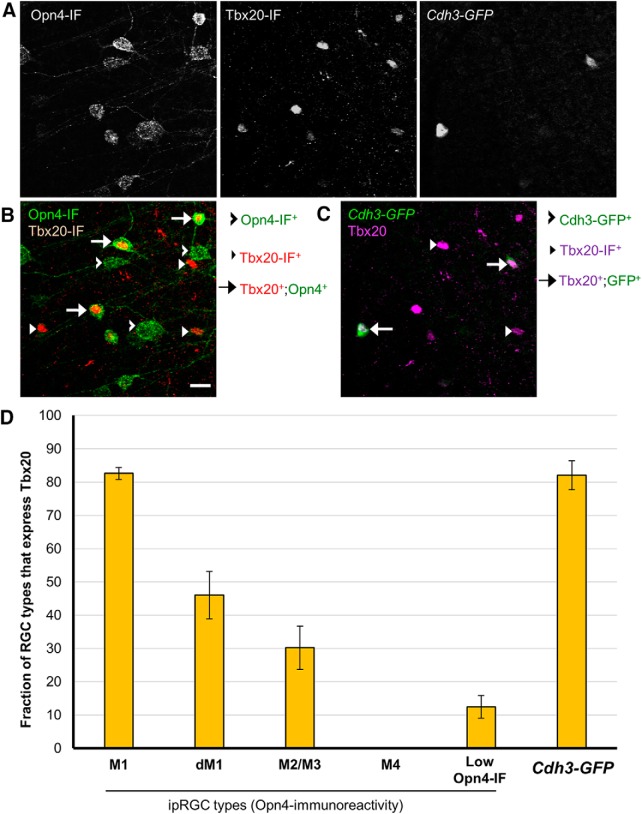
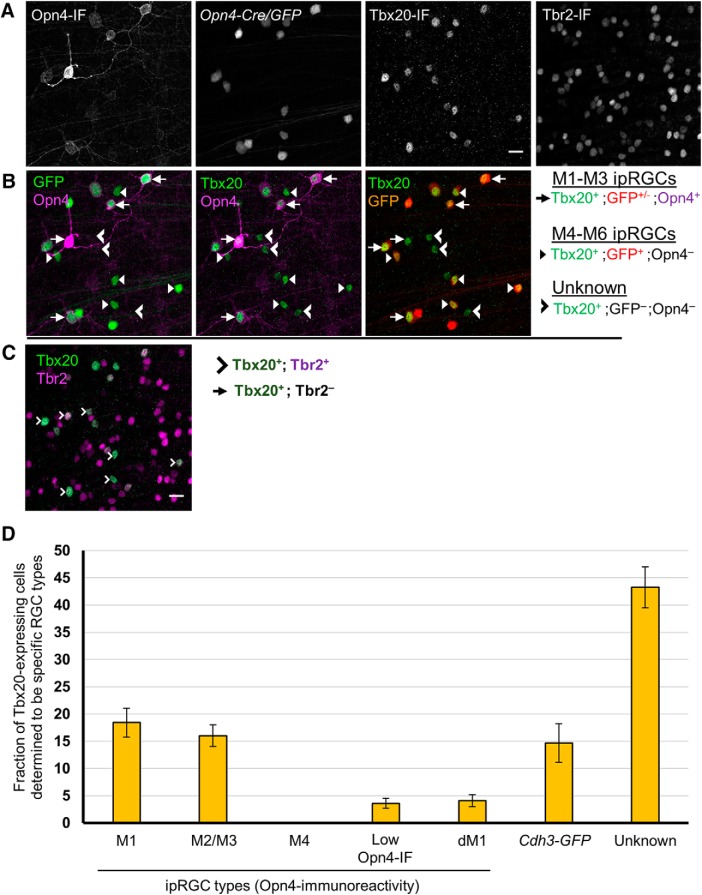
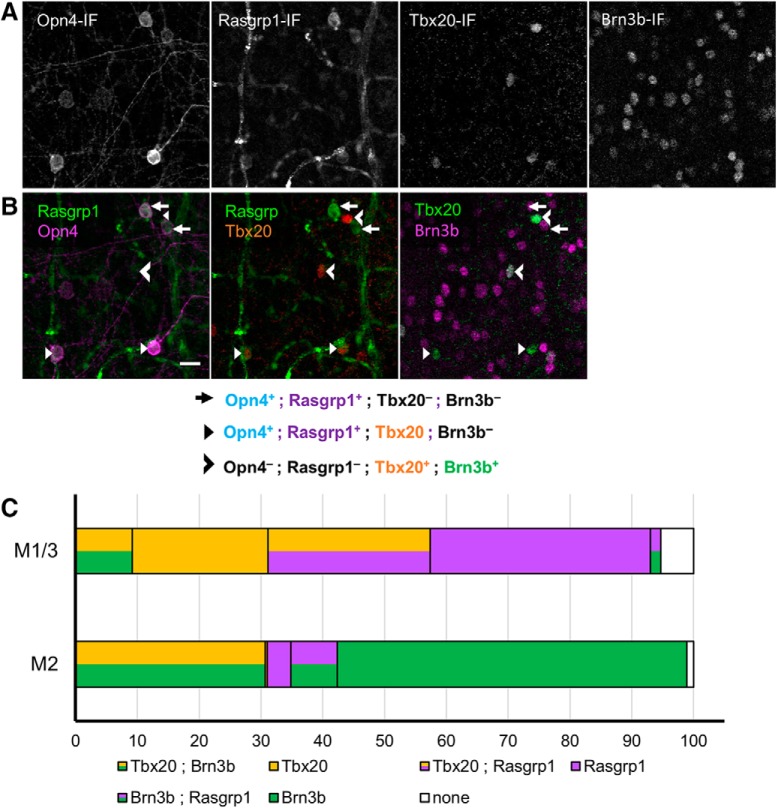
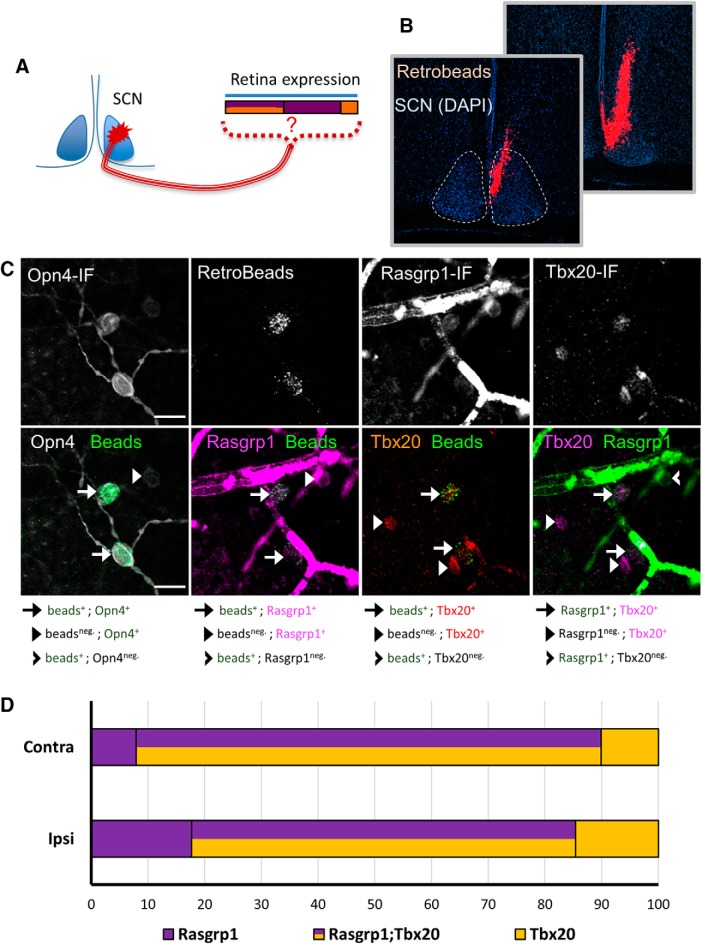
Intrinsically photosensitive retinal ganglion cells (ipRGCs) are rare mammalian photoreceptors essential for non-image-forming vision functions, such as circadian photoentrainment and the pupillary light reflex. They comprise multiple subtypes distinguishable by morphology, physiology, projections, and levels of expression of melanopsin (Opn4), their photopigment. The molecular programs that distinguish ipRGCs from other ganglion cells and ipRGC subtypes from one another remain elusive. Here, we present comprehensive gene expression profiles of early postnatal and adult mouse ipRGCs purified from two lines of reporter mice that mark different sets of ipRGC subtypes. We find dozens of novel genes highly enriched in ipRGCs. We reveal that Rasgrp1 and Tbx20 are selectively expressed in subsets of ipRGCs, though these molecularly defined groups imperfectly match established ipRGC subtypes. We demonstrate that the ipRGCs regulating circadian photoentrainment are diverse at the molecular level. Our findings reveal unexpected complexity in gene expression patterns across mammalian ipRGC subtypes.

Keywords: RNA-seq; cell type; circadian; intrinsically photosensitive; retinal ganglion; vision.


Figures

Figure 1.
Figure 1.
Experimental design of gene expression profiling from purified ipRGCs and comparison with generic RGCs. A, Current model of ipRGC family members integrating molecular, physiology, brain circuitry, and morphology (see text for details). B, Two transgenic reporters were used for gene expression profiling of ipRGCs. The BAC transgenic Opn4-GFP labels M1–M3 ipRGCs, whereas the Opn4-Cre crossed with a cre-dependent GFP reporter labels M1–M6 ipRGCs. Within the schematic of the gene expression profiling procedure: (1) Isolation of cell populations from enzymatically dissociated retinas. (2) The surface protein Thy-1 is enriched in RGCs, this high affinity of Thy1-conjugated magnetic beads to RGCs was used to enrich the extracted cell populations with RGCs. (3) FACS was used to isolate GFP-positive cells (ipRGCs) from GFP-negative cells (cRGCs). These two populations were isolated in parallel to provide direct internal testing of ipRGCs versus cRGCs under the same treatments, conditions, and genetic backgrounds. (4) The RNA of these two main populations was subjected to mRNA extraction. (5) The RNA was converted to cDNA and amplified using Nugen Ovation RNA amplification system. (6) Illumina TruSeq sequencing libraries were prepared by ligating adapters to the cDNA. Single-end 50 bp sequencing was completed using the Illumina HiSeq system. (7) DEGs were determined using EdgeR bioinformatics pipeline. See Materials and Methods for details.
Figure 2.
Figure 2.
FACS gating strategy for isolating ipRGCs (GFP+) in parallel with GFP-negative cells that are enriched for RGCs. AC, Healthy cells were selected against death marker 7-AAD (not G1). The ipRGCs (GFP+) and generic RGCs (GFP) cells were selected based on intensity and similar relative cell size ultimately using gates G2A and G3A, respectively. A, Example sort from retina of P4 Opn4-GFP mouse. B, Example sort from retina of young adult Opn4-GFP mouse, with noticeably higher debris and cell death. C, Microscopy testing of accurate sorting of GFP+ cells isolated from P4 Opn4-Cre/GFP mouse. D, Total sequenced reads from adult Opn4-GFP and Opn4-Cre/GFP reporters.
Figure 3.
Figure 3.
Characterization of Opn4-based fluorescent reporters for gene expression studies. A, Immunofluorescence of anti-Opn4 immunofluorescence (IF) of whole-mount retina from transgenic Opn4-GFP mice with fluorescent protein expression in ipRGCs. Red, Opn4-immunolabeling; green, fluorescently labeled cells; yellow, merged colocalized labeling pattern. Scale bar, 20 μm. B, Coexpression of Opn4-Cre/GFP labeling with immunofluorescence of anti-Opn4 staining of whole-mount retina. Red, Opn4-immunolabeling; green, fluorescently labeled cells; yellow, merged colocalized labeling pattern. Scale bar, 20 μm. C, Quantification of labeling efficiency of Opn4-immunolabeled M1–M3 ipRGCs by Opn4-Cre/GFP. Additional comparison of GFP-labeling in low Opn4-expressing ipRGC subtypes M4 (large soma) and M5/6 (small soma).
Figure 4.
Figure 4.
Scatterplot analysis of relative gene expression and dispersion of biological replicates from positively-selected ipRGCs and enriched cRGCs. A, Volcano plot analysis of gene transcripts with positive fold-change (x-axis; ipRGC-enriched relative to cRGCs) plotted against the negative logarithm of the FDR (y-axis). Significant differentially expressed transcripts (FDR < 0.05) are represented as red dots, whereas transcript with FDR > 0.05 have black dots; blue transcripts, Parv-Cre/TdT enriched; red, SNS-Cre/TdT enriched, twofold, p < 0.05). The most significant genes from each sample set are attributed with gene name labels, with limits implemented for text readability (FDR < 1E−20 and logFC > 2 for postnatal age Opn4-GFP reporter; FDR < 1E−4 and logFC > 3 for adult ipRGC reporters). B, EdgeR MDS plot illustrates the overall similarity between expression profiles of different samples. Each sample is denoted by a letter (“i” for ipRGCs; “c” for cRGCs) and a number, corresponding to particular replicate, comprising one pool of purified RGCs then divided into the two pools. Numbering scheme represents paired ipRGCs (GFP+) and cRGCs (GFP) replicates (i.e., ipRGC sample “i1” was processed in parallel with cRGC sample “c1”, sample “i2” with “c2”, etc.). Distances are approximately the log2 fold-changes between samples. Green and gray ovals represent ipRGC (GFP+) and cRGC (GFP) samples, respectively. Adapted from EdgeR simple graphical output of individual samples in 2D space.
Figure 5.
Figure 5.
Purity and cell composition assessment of ipRGC and generic RGC samples. Heat map of known cell type marker gene expression in the retina to assess purity and cell composition of ipRGC and generic RGC samples. Shown are biological replicates tested for Opn4-GFP (P5 and adult) and Opn4-Cre/GFP reporters. Relative expression levels, fold-change, and FDR are color-coded as indicated in the figure. White boxes indicate high gene expression, whereas blue represents little or no detected expression. FDR is not available (NA) in cases that our analysis filtered out genes with very low counts, <1 cpm, in more than one-half of the samples used in the differential expression analysis.
Figure 6.
Figure 6.
The expression pattern of candidate ipRGC-specific genes. Heat map of 83 genes differentially expressed in ipRGCs that have functional links to GPCR signaling, regulation, and maintenance of molecular programs, neuron communication and organization, neuron survival, and neuron-glia interactions. Relative expression levels, fold-change, and FDR are color-coded as indicated in the figure.
Figure 7.
Figure 7.
Expression pattern differences between Opn4-based reporters. Heat map of genes differentially expressed in adult ipRGCs labeled by the Opn4-Cre/GFP reporter (M1–M6 ipRGCs) compared with Opn4-GFP (M1–M3 ipRGCs). Relative expression levels, fold-change, and FDR are color-coded as indicated in the figure.
Figure 8.
Figure 8.
The expression pattern of neurotransmitter receptors. Heat map of genes encoding for nicotinic acetylcholine, dopamine, serotonin, glycine, glutamate, and melatonin receptors. Relative expression levels, fold-change, and FDR are color-coded as indicated in the figure.
Figure 9.
Figure 9.
The expression pattern of developmentally regulated genes in ipRGCs. A, Heat map of genes encoding transcription factors that have a particular temporal pattern of differential expression in ipRGCs (e.g., high gene expression in P5 ipRGCs relative to adult expression). Relative expression levels, fold-change, and FDR are color-coded as indicated in the figure. B, Heat map of genes relevant for development of ipRGCs. Relative expression levels, fold-change, and FDR are color-coded as indicated in the figure.
Figure 10.
Figure 10.
Phototransduction-related gene expression. A, Distinct from rod and cone photoreceptors, the light-activation of Opn4 triggers a membrane-bound signaling cascade including Gq/11 type G-proteins, the generation of DAG by PLCβ4, the opening of downstream TRPC6 and TRPC7 channels, and ultimately leads to the influx of calcium through L-type voltage-gated calcium channels. B, Heat map of genes that are potentially relevant to the Opn4-mediated phototransduction signaling cascade. Relative expression levels, fold-change, and FDR are color-coded as indicated in the figure. C, Heat map of genes previously described to play a role in the light response, dark adaptation, and chromophore regeneration of rod and cone photoreceptors. Relative expression levels, fold-change, and FDR are color-coded as indicated in the figure.
Figure 11.
Figure 11.
Rasgrp1 is selectively expressed in ipRGCs. A, Whole-mount retina immunostained for Opn4, Rasgrp1, and the pan-RGC marker Rbpms (gray scale). Focal plane is at the GCL. We quantified colocalization of the three markers in confocal images of 49 regions that were topographically dispersed across three whole-mount adult retinas. Colocalization of Rasgrp1 (green), Rbpms (red), and Opn4 (magenta). Rasgrp1 is expressed in a subpopulation of amacrine cells and RGCs (Rbpms-negative and -positive, respectively). Scale bar, 20 µm. B, Rasgrp1 immunolabeling (antibody sc-8430) of cell bodies in GCL of Rasgrp1± heterozygous mice (left, yellow arrows). Absence of cell body immunolabeling in Rasgrp1-/- knock-out mice (right) suggests a lack of cellular off-target antibody staining. C, Quantification of Rasgrp1-expression across Opn4-immunopositive ipRGC subtypes. 70% of M1 and displaced M1 (dM1) cells were Rasgrp1-immunopositive, whereas only 20–30% of either M2, M5, or M6 cells were Rasgrp1-immunopositive. None of the identified M4 cells were Rasgrp1-immunopositive. M1 and M3 types were combined during the process of coexpression analysis (designated M1/M3). Error bars represent SEM. D, Distribution of all Rasgrp1-expressing RGCs (Rasgrp1+;Rbpms+) that belong to specific RGC types, to the extent that could be determined, including Opn4-immunoreactive ipRGC subtypes. No examples of M4 cells were observed to express Rasgrp1. The vast majority (96%) of Rasgrp1-RGCs are Opn4-immunopositive and therefore ipRGCs. The remaining “unknown” RGC types expressing Rasgrp1 (Rasgrp1+; Rbpms+; Opn4neg.) could be a low-expressing ipRGC type or conventional RGCs. Error bars represent SEM.
Figure 12.
Figure 12.
Colocalization study of Tbx20-expression in ipRGC subtypes. A, Triple immunofluorescence of Opn4, Tbx20, and Cdh3-GFP (gray scale). B, Tbx20-expression in subset of M1–M3 ipRGCs as well as an additional population of Opn4-immunonegative cells. B, C, Tbx20 is concentrated in the nucleus of most Cdh3-GFP-cells. D, Quantification of Tbx20-expression across Opn4-immunopositive ipRGC subtypes. Tbx20 immunofluorescence labels multiple ipRGC subtypes, including M1s, M2 cells and small soma, low Opn4 expression cells (presumptive M5/M6 ipRGCs), and Cdh3-GFP cells (M6-type enriched). M2 and M3 types were combined during the process of coexpression analysis (designated M2/M3). Error bars represent SEM.
Figure 13.
Figure 13.
Coexpression study of Tbx20 with Opn4-Cre/GFP and Tbr2, including distribution of Tbx20-expression across ipRGC subtypes. AC, Quadruple immunofluorescence of Opn4, Tbx20, Opn4-Cre/GFP, and Tbr2. Scale bar, 20 μm. A, Gray scale of Opn4, Opn4-Cre/GFP, and Tbx20 immunofluorescence. B, Coexpression study of Tbx20 (green) in the context of Opn4 (magenta) and Opn4-Cre/GFP (red) labeling. GFP cells that are Opn4-immunonegative are inferred M4-M6 types. C, Coexpression analysis of Tbr2 (magenta) with Tbx20 (green). D, Distribution of Tbx20 expressing cells that belong to specific RGC types, to the extent that could be determined, including Opn4-immunoreactive ipRGC subtypes and RGCs labeled by the Cdh3-GFP transgenic reporter. Unaccounted Tbx20-expressing cells are designated as “unknown” RGC types. Error bars represent SEM.
Figure 14.
Figure 14.
Complex pattern of Rasgrp1-Tbx20-Brn3b coexpression suggests further diversity in ipRGC family. A, Quadruple immunofluorescence study of Tbx20, Brn3b, Opn4, and Rasgrp1 (gray scale). B, Rasgrp1 and Opn4 (left) were initially quantified for ipRGC subtype expression before comparison with Tbx20 (middle) and Brn3b (right) expression. Rasgrp1, Brn3b, and Tbx20 expression are partially overlapping. C, Integrated coexpression patterns of Brn3b, Rasgrp1, and Tbx20 with M1 and M2 ipRGC subtypes. The M1 group includes displaced M1 and M3 types.
Figure 15.
Figure 15.
The ipRGCs projecting to the SCN have a molecularly diverse pattern of Rasgrp1 and Tbx20 expression. A, Experimental design of fluorescent bead injection to SCN, followed by examination of Rasgrp1 and Tbx20 expression in retrograde labeled RGCs. B, Neuro-anatomical study to verify that retrograde injection is within the SCN, but not the optic nerve. C, Triple immunofluorescence of Opn4, Rasgrp1, and Tbx20 in combination with fluorescent Retrobeads. Retrobeads were mostly observed in Opn4-immunopositive RGCs (M1–M3 ipRGCs). Quantification of Rasgrp1 and Tbx20 in retrolabeled cells. D, SCN-projecting ipRGCs in the ipsilateral and contralateral retina are molecularly diverse for Tbx20 and Rasgrp1 expression.

Similar articles

Cited by

References

    1. Anders S, Huber W (2010) Differential expression analysis for sequence count data. Genome Biol 11:R106. 10.1186/gb-2010-11-10-r106 - DOI - PMC - PubMed
    1. Anders S, McCarthy DJ, Chen Y, Okoniewski M, Smyth GK, Huber W, Robinson MD (2013) Count-based differential expression analysis of RNA sequencing data using R and Bioconductor. Nat Protoc 8:1765–1786. 10.1038/nprot.2013.099 - DOI - PubMed
    1. Atlasz T, Szabadfi K, Kiss P, Racz B, Gallyas F, Tamas A, Gaal V, Marton Z, Gabriel R, Reglodi D (2010) Pituitary adenylate cyclase activating polypeptide in the retina: focus on the retinoprotective effects. Ann N Y Acad Sci 1200:128–139. 10.1111/j.1749-6632.2010.05512.x - DOI - PubMed
    1. Barres BA, Silverstein BE, Corey DP, Chun LLY (1988) Immunological, morphological, and electrophysiological variation among retinal ganglion cells purified by panning. Neuron 1:791–803. 10.1016/0896-6273(88)90127-4 - DOI - PubMed
    1. Baver SB, Pickard GE, Sollars PJ, Pickard GE (2008) Two types of melanopsin retinal ganglion cell differentially innervate the hypothalamic suprachiasmatic nucleus and the olivary pretectal nucleus. Eur J Neurosci 27:1763–70. - PubMed

Publication types

Substances