

Relating Divisive Normalization to Neuronal Response Variability
- PMID: 31387914
- PMCID: PMC6759019
- DOI: 10.1523/JNEUROSCI.0126-19.2019
Relating Divisive Normalization to Neuronal Response Variability
Erratum in
-
Erratum: Coen-Cagli and Solomon, "Relating Divisive Normalization to Neuronal Response Variability".J Neurosci. 2020 Sep 9;40(37):7188. doi: 10.1523/JNEUROSCI.1916-20.2020. Epub 2020 Aug 25. J Neurosci. 2020. PMID: 32843529 Free PMC article. No abstract available.
Abstract
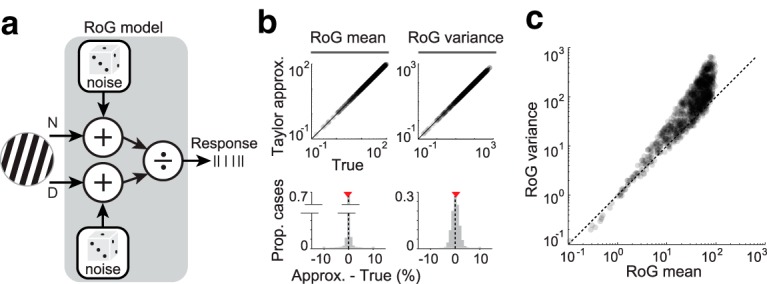
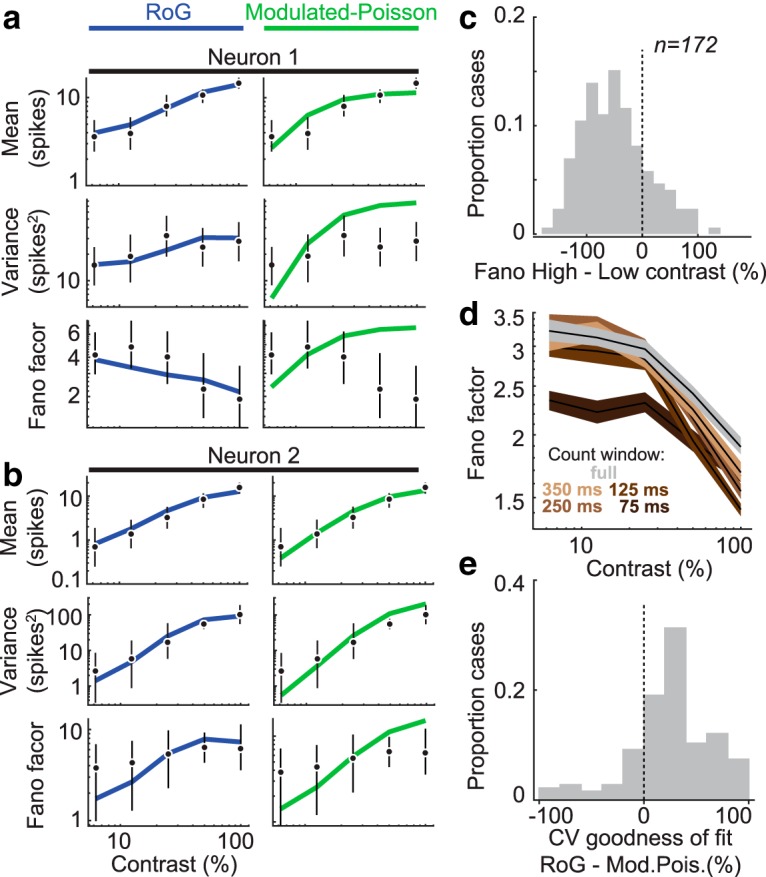
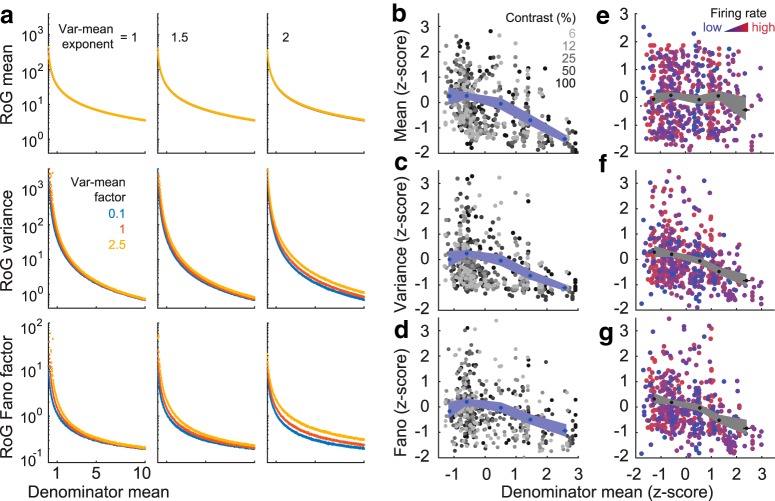
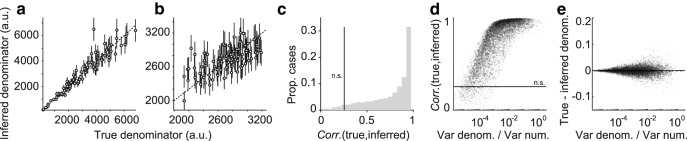
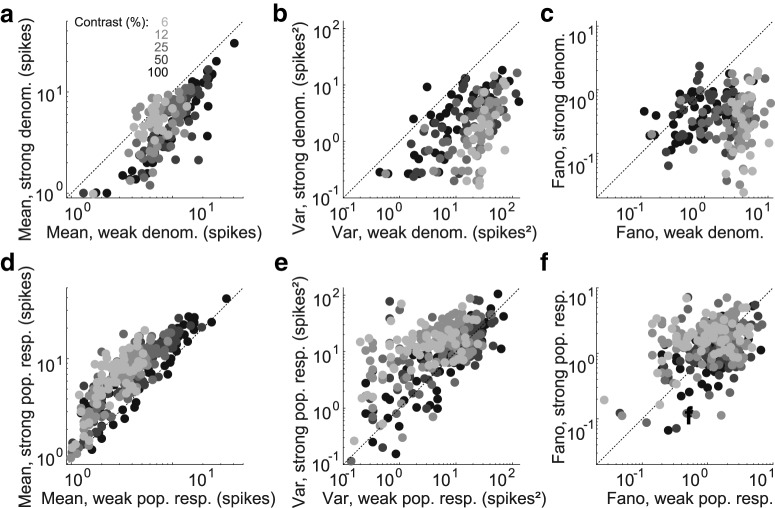
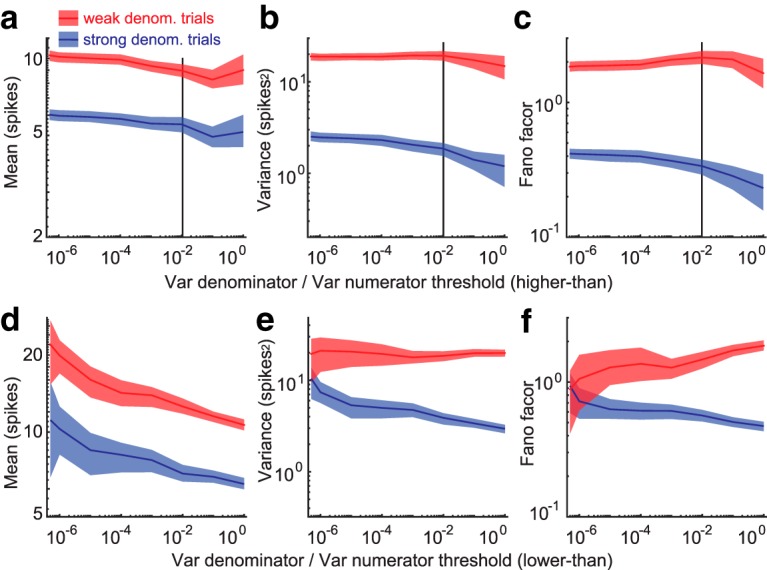
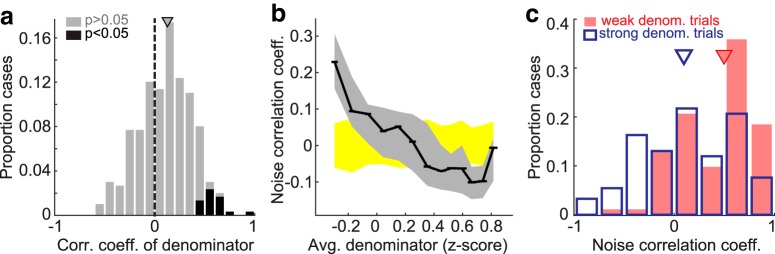
Cortical responses to repeated presentations of a sensory stimulus are variable. This variability is sensitive to several stimulus dimensions, suggesting that it may carry useful information beyond the average firing rate. Many experimental manipulations that affect response variability are also known to engage divisive normalization, a widespread operation that describes neuronal activity as the ratio of a numerator (representing the excitatory stimulus drive) and denominator (the normalization signal). Although it has been suggested that normalization affects response variability, we lack a quantitative framework to determine the relation between the two. Here we extend the standard normalization model, by treating the numerator and the normalization signal as variable quantities. The resulting model predicts a general stabilizing effect of normalization on neuronal responses, and allows us to infer the single-trial normalization strength, a quantity that cannot be measured directly. We test the model on neuronal responses to stimuli of varying contrast, recorded in primary visual cortex of male macaques. We find that neurons that are more strongly normalized fire more reliably, and response variability and pairwise noise correlations are reduced during trials in which normalization is inferred to be strong. Our results thus suggest a novel functional role for normalization, namely, modulating response variability. Our framework could enable a direct quantification of the impact of single-trial normalization strength on the accuracy of perceptual judgments, and can be readily applied to other sensory and nonsensory factors.SIGNIFICANCE STATEMENT Divisive normalization is a widespread neural operation across sensory and nonsensory brain areas, which describes neuronal responses as the ratio between the excitatory drive to the neuron and a normalization signal. Normalization plays a key role in several important computations, including adjusting the neuron's dynamic range, reducing redundancy, and facilitating probabilistic inference. However, the relation between normalization and neuronal response variability (a fundamental aspect of neural coding) remains unclear. Here we develop a new model and test it on primary visual cortex responses. We show that normalization has a stabilizing effect on neuronal activity, beyond the known suppression of firing rate. This modulation of variability suggests a new functional role for normalization in neural coding and perception.
Keywords: divisive normalization; modeling; neuronal variability; single-trial inference; visual cortex.
Copyright © 2019 the authors.
Figures
Similar articles
-
Divisive Normalization Predicts Adaptation-Induced Response Changes in Macaque Inferior Temporal Cortex.J Neurosci. 2016 Jun 1;36(22):6116-28. doi: 10.1523/JNEUROSCI.2011-15.2016. J Neurosci. 2016. PMID: 27251630 Free PMC article.
-
Stimulus Dependence of Correlated Variability across Cortical Areas.J Neurosci. 2016 Jul 13;36(28):7546-56. doi: 10.1523/JNEUROSCI.0504-16.2016. J Neurosci. 2016. PMID: 27413163 Free PMC article.
-
Modeling the diverse effects of divisive normalization on noise correlations.PLoS Comput Biol. 2023 Nov 30;19(11):e1011667. doi: 10.1371/journal.pcbi.1011667. eCollection 2023 Nov. PLoS Comput Biol. 2023. PMID: 38033166 Free PMC article.
-
The divisive normalization model of V1 neurons: a comprehensive comparison of physiological data and model predictions.J Neurophysiol. 2017 Dec 1;118(6):3051-3091. doi: 10.1152/jn.00821.2016. Epub 2017 Aug 23. J Neurophysiol. 2017. PMID: 28835531 Free PMC article. Review.
-
Normalization as a canonical neural computation.Nat Rev Neurosci. 2011 Nov 23;13(1):51-62. doi: 10.1038/nrn3136. Nat Rev Neurosci. 2011. PMID: 22108672 Free PMC article. Review.
Cited by
-
Coordinated multiplexing of information about separate objects in visual cortex.Elife. 2022 Nov 29;11:e76452. doi: 10.7554/eLife.76452. Elife. 2022. PMID: 36444983 Free PMC article.
-
Neuronal heterogeneity of normalization strength in a circuit model.bioRxiv [Preprint]. 2024 Nov 22:2024.11.22.624903. doi: 10.1101/2024.11.22.624903. bioRxiv. 2024. PMID: 39605397 Free PMC article. Preprint.
-
Relating natural image statistics to patterns of response covariability in macaque primary visual cortex.Nat Commun. 2025 Jul 22;16(1):6757. doi: 10.1038/s41467-025-62086-1. Nat Commun. 2025. PMID: 40695825 Free PMC article.
-
Early versus late noise differentially enhances or degrades context-dependent choice.Nat Commun. 2025 Apr 23;16(1):3828. doi: 10.1038/s41467-025-59140-3. Nat Commun. 2025. PMID: 40268924 Free PMC article.
-
Divisive normalization is an efficient code for multivariate Pareto-distributed environments.Proc Natl Acad Sci U S A. 2022 Oct 4;119(40):e2120581119. doi: 10.1073/pnas.2120581119. Epub 2022 Sep 26. Proc Natl Acad Sci U S A. 2022. PMID: 36161961 Free PMC article.
References
-
- Barlow HB. (1961) Possible principles underlying the transformation of sensory messages. In: Sensory communication (Rosenblith WA, ed), pp 217–234. Cambridge, MA: Massachusetts Institute of Technology.
Publication types
MeSH terms
Grants and funding
LinkOut - more resources
Full Text Sources