. 2019 Sep 2;218(9):3002-3018.
doi: 10.1083/jcb.201901156. Epub 2019 Aug 6.

BIK ubiquitination by the E3 ligase Cul5-ASB11 determines cell fate during cellular stress

Affiliations

BIK ubiquitination by the E3 ligase Cul5-ASB11 determines cell fate during cellular stress

Fei-Yun Chen et al. J Cell Biol. .

Abstract

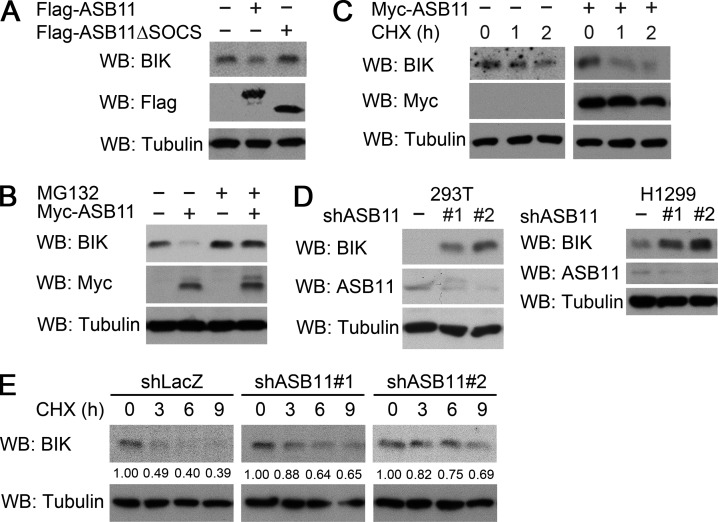
The BH3-only pro-apoptotic protein BIK is regulated by the ubiquitin-proteasome system. However, the mechanism of this regulation and its physiological functions remain elusive. Here, we identify Cul5-ASB11 as the E3 ligase targeting BIK for ubiquitination and degradation. ER stress leads to the activation of ASB11 by XBP1s during the adaptive phase of the unfolded protein response, which stimulates BIK ubiquitination, interaction with p97/VCP, and proteolysis. This mechanism of BIK degradation contributes to ER stress adaptation by promoting cell survival. Conversely, genotoxic agents down-regulate this IRE1α-XBP1s-ASB11 axis and stabilize BIK, which contributes in part to the apoptotic response to DNA damage. We show that blockade of this BIK degradation pathway by an IRE1α inhibitor can stabilize a BIK active mutant and increase its anti-tumor activity. Our study reveals that different cellular stresses regulate BIK ubiquitination by ASB11 in opposing directions, which determines whether or not cells survive, and that blocking BIK degradation has the potential to be used as an anti-cancer strategy.


Figures

Figure 1.
Figure 1.
Cul5ASB11 targets BIK for ubiquitination. (A and B) Western blot (WB) analysis of endogenous BIK expression in 293T cells transiently transfected with the indicated Cullin DN mutants (A) or transduced with lentivirus carrying the indicated shRNAs (B). (C) Immunoprecipitation (IP) analysis of the interaction between endogenous ASB11 and endogenous BIK in 293T cells. (D) In vitro interaction of ASB11 with BIK. Purified ASB11 bound on anti-Myc beads was incubated with BIK separately purified by and eluted from anti-Flag beads. The bound proteins were analyzed by Western blot. (E) Analysis of BIK ubiquitination in 293T cells transfected with the indicted constructs. The ubiquitinated proteins were pulled down under denaturing conditions by Ni-NTA agarose and analyzed by Western blot. The asterisk denotes a nonspecific band. (F) Analysis of BIK ubiquitination in 293T cells stably expressing control or ASB11 shRNA and transfected with the indicated constructs. The knockdown efficiencies of ASB11 shRNAs are shown in Fig. 2 D. (G) Analysis of BIK K48 ubiquitination in 293T cells transfected with the indicated constructs. BIK was precipitated from cell lysate under denaturing conditions by Ni-NTA agarose and analyzed by Western blot with K48 polyubiquitin chain-specific antibody. (H) In vitro ubiquitination assay for BIK. Flag-BIK purified from 293T cells was incubated with E1, E2, His-ubiquitin, and/or ASB11-based Cul5 complex purified from transfected cells. The integrity of the input E3 ligase complex is shown on the right.
Figure 2.
Figure 2.
ASB11 promotes BIK proteasomal degradation. (A) Western blot (WB) analysis of endogenous BIK in 293T cells transfected with the indicated ASB11 constructs. (B and C) Western blot analysis of BIK levels in 293T cells transfected with ASB11 and treated with MG132 for 16 h or cycloheximide for the indicated time points. (D) Western blot analysis of BIK levels in the indicated cells stably expressing control or ASB11 shRNAs. (E) Western blot analysis of BIK in 293T derivatives as in D treated with cycloheximide for the indicated time points. The relative amounts of BIK are indicated by assigning the values from untreated cells as 1.
Figure 3.
Figure 3.
ER stress induces ASB11 transcription through the XBP1s–NF-Y complex. (A and C) RT-qPCR analysis of the ASB11 mRNA level in 293T cells (A) or 293T cells stably expressing control or XBP1 shRNAs (C) treated with tunicamycin or thapsigargin for 16 h. (B) Western blot (WB) analysis of ASB11 expression in 293T cells treated as in A. (D) RT-qPCR analysis of ASB11 mRNA expression in 293T cells transfected with control vector or XBP1s. (E) Schematic representation of the 5′ regulatory region of the ASB11 gene, the luciferase reporters, and the ChIP primers used in this study. (F and H) Luciferase reporter assays of 293T cells transfected with control or XBP1s expression construct together with the indicated reporter constructs. ERSEI reporter was used as a positive control. (G and L) Quantitative ChIP assays in 293T cells (G) or 293T derivatives (L) treated with 10 µg/ml tunicamycin for 4 h using control IgG or XBP1s antibody for immunoprecipitation and indicated sets of primers for qPCR. Primers encompassing the XBP1s binding region of the EDEM1 promoter were used as a positive control. (I) Immunoprecipitation (IP) analysis of the interaction between endogenous XBP1s and each NF-Y complex component in 293T cells treated with 10 µg/ml tunicamycin for 4 h. (J and K) Luciferase reporter assays of 293T cells stably expressing the indicated shRNAs and transfected with the 0.5-kb reporter construct together with XBP1s or treated with 10 µg/ml tunicamycin for 16 h. The knockdown efficiencies of the indicated shRNAs are shown on the right. Data in A, C, D, F–H, and J–L are mean ± SD; n = 3. P values were determined by t test (A and right panel in C, D, and F) or one-way ANOVA with Tukey’s post hoc test (left panel in C, G, H, and J–L). **P < 0.01; ***P < 0.001.
Figure 4.
Figure 4.
ER stress stimulates BIK ubiquitination and degradation through ASB11 and p97. (A) Western blot (WB) analysis of BIK and ASB11 levels in 293T cells treated with 10 µg/ml tunicamycin or 200 nM thapsigargin for 16 h. (B) Western blot analysis of BIK and ASB11 levels in 293T cells treated with tunicamycin (upper) or cotreated with tunicamycin and MG132 (lower) for the indicated time points. (C) Western blot analysis of BIK levels in 293T cells treated with 10 µg/ml tunicamycin for 12 h and then with 50 µg/ml cycloheximide (CHX) for the indicated time periods. The relative amounts of BIK are indicated by assigning the values from the initial time point as 1. (D and F) Analysis of endogenous (D) or exogenous (F) BIK ubiquitination in 293T cells (D) or 293T derivatives as in Fig. 2 D (F) transfected with the indicated constructs and treated with tunicamycin. (E) Western blot analysis of 293T derivatives as in Fig. 2 D treated with 10 µg/ml tunicamycin for 16 h. (G) Western blot analysis of BIK levels in 293T derivatives cotreated with 10 µg/ml tunicamycin and MG132 for 16 h. (H and I) Western blot analysis of BIK expression in 293T cells cotreated with tunicamycin and 1 µM CB-5083 for 16 h (H) or transiently transfected with ASB11 and treated with CB-5803 for 16 h (I). (J and K) Western blot analysis of BIK expression in 293T cells stably expressing the indicated shRNAs and treated with 10 µg/ml tunicamycin for 16 h. The knockdown efficiency of each shRNA is shown on the right. (L) Immunoprecipitation (IP) analysis of p97 interaction with ubiquitinated BIK in 293T cells treated with 10 µg/ml tunicamycin for 16 h.
Figure 5.
Figure 5.
DNA damage–induced p53 suppresses XBP1 and ASB11 to stabilize BIK. (A) RT-qPCR analysis of ASB11 mRNA expression in indicated HCT116 cells treated with the indicated dosages of doxorubicin or 5-FU for 24 h. Data are mean ± SD; *P < 0.05, **P < 0.01, ***P < 0.001 by t test; n = 3. (B) Western blot (WB) analysis of BIK and ASB11 expression in the indicated HCT116 cells treated as in A. (C) HCT116 p53+/+ cells stably expressing control or ASB11 shRNA were treated with 10 µM 5-FU for 24 h and then with cycloheximide (CHX) for the indicated time points. Cells were lysed for Western blot analysis of BIK expression. For a clear comparison, the exposure times of the four BIK blots were adjusted to make the initial points (time 0) with similar intensities. The relative amounts of BIK are indicated by assigning the values from the initial time point as 1. The expression levels of ASB11 and BIK in the stable lines are shown in the bottom panel. (D) Western blot analysis of IRE1α expression and RT-PCR analysis of XBP1 mRNA splicing in the indicated HCT116 cells treated with 3 µg/ml doxorubicin or 10 µM 5-FU for 24 h. The unspliced (U), spliced (S), and hybrid (H) forms of XBP1 are indicated. (E) RT-qPCR and Western blot analyses of ASB11 and XBP1s expression in HCT116 cells transfected with XBP1s and/or treated with 3 µg/ml doxorubicin for 24 h. Data are mean ± SD; ***P < 0.001 by t test; n = 3. (F) Analysis of BIK ubiquitination in HCT116 cells transfected with the indicated constructs and/or treated with 3 µg/ml doxorubicin for 24 h.
Figure 6.
Figure 6.
Regulation of ASB11-mediated BIK ubiquitination influences on cell life/death decision under DNA damage. (A) ELISA assay for cell apoptosis in HCT116 p53+/+ cells stably expressing BIK shRNA. (B and C) ELISA assay of cell apoptosis (B) and Western blot (WB) analysis of active caspase 3 and cleaved PARP (C) in HCT116 p53+/+ cells stably expressing the indicated ASB11 constructs and treated with 3 µg/ml doxorubicin for 24 h. (D and E) ELISA assay of cell apoptosis (D) and Western blot analysis of active caspase 3 and cleaved PARP (E) in HCT116 p53+/+ cells transiently transfected with ASB11 and/or BIK and treated with 3 µg/ml doxorubicin for 24 h. Data in A, B, and D are mean ± SD; ***P < 0.001 by one-way ANOVA with Tukey’s post hoc test; n = 3. Asterisks in C and E denote a nonspecific band.
Figure 7.
Figure 7.
Regulation of ASB11-mediated BIK ubiquitination influences on cell life/death decision under ER stress. (A–C) ELISA assay for cell apoptosis (A and B) and Western blot (WB) analysis of active caspase 3 and cleaved PARP (C) in 293T cells stably expressing the indicated shRNAs and treated with 10 µg/ml tunicamycin for the indicated time points (A) or for 12 h (B and C). The knockdown efficiencies of various shRNAs are shown in the right panel of C. n.s., not significant. (D) Analysis of ubiquitination of wild-type and mutant BIK in 293T cells transfected with the indicated constructs. The ubiquitinated proteins were pulled down under denaturing conditions by Ni-NTA agarose and analyzed by Western blot. (E) Western blot analysis of BIK level in BIK knockdown 293T cells transiently transfected with the indicated BIK constructs and treated with 10 µg/ml tunicamycin for 16 h. The equal expression of BIK and BIK(2KR) in untreated cells (by adjusting the amount of plasmid used for transfection) is shown. (F and G) ELISA assay of apoptotic cells (F) and Western blot analysis of active caspase 3 and cleaved PARP (G) in 293T cells transfected using the same conditions as in E and treated with 10 µg/ml tunicamycin for the indicated time points. Data in A, B, and F are mean ± SD; ***P < 0.001 by one-way ANOVA with Tukey’s post hoc test; n = 3. n.s., not significant.
Figure 8.
Figure 8.
IRE1α inhibitor enhances the tumor-killing effect of BIKDD. (A and C) MTT assay for the viability of the indicated TNBC cells transfected with 0.5 µg CMV-BIKDD (A) or VISA-BIKDD (C) and treated with 10 or 100 µM STF-083010 for 48 h. Data are mean ± SD; *P < 0.05, **P < 0.01, ***P < 0.001 by one-way ANOVA with Tukey’s post hoc test; n = 3. CI values are indicated. (B) Western blot (WB) analysis of cleaved PARP in the indicated TNBC cells transfected with CMV-BIKDD and treated with 100 µM STF-083010 for 36 h. (D) Mice orthotopically implanted with Hs578T cells carrying BIKDD or control vector and treated with STF-083010 or DMSO (left panel). Tumor volumes were measured at the indicated days and plotted (middle panel). Data are mean ± SD; ***P < 0.001 by two-way ANOVA with Tukey’s post hoc test; n = 5. Tumors were surgically removed at day 49, and their sizes are shown on the right. (E) Mice orthotopically implanted with Hs578T cells and treated with VISA-BIKDD liposome nanoparticle together with STF-083010 or DMSO starting at day 28 after tumor cell implantation (left panel). Tumor volumes were measured at the indicated days and plotted (middle panel). Data are mean ± SD; ***P < 0.001 by two-way ANOVA with Tukey’s post hoc test; n = 5. Tumors were surgically removed at day 66, and their sizes are shown on the right.

References

    1. Acosta-Alvear D., Zhou Y., Blais A., Tsikitis M., Lents N.H., Arias C., Lennon C.J., Kluger Y., and Dynlacht B.D.. 2007. XBP1 controls diverse cell type- and condition-specific transcriptional regulatory networks. Mol. Cell. 27:53–66. 10.1016/j.molcel.2007.06.011 - DOI - PubMed
    1. Andresen C.A., Smedegaard S., Sylvestersen K.B., Svensson C., Iglesias-Gato D., Cazzamali G., Nielsen T.K., Nielsen M.L., and Flores-Morales A.. 2014. Protein interaction screening for the ankyrin repeats and suppressor of cytokine signaling (SOCS) box (ASB) family identify Asb11 as a novel endoplasmic reticulum resident ubiquitin ligase. J. Biol. Chem. 289:2043–2054. 10.1074/jbc.M113.534602 - DOI - PMC - PubMed
    1. Avci D., and Lemberg M.K.. 2015. Clipping or Extracting: Two Ways to Membrane Protein Degradation. Trends Cell Biol. 25:611–622. 10.1016/j.tcb.2015.07.003 - DOI - PubMed
    1. Boyd J.M., Gallo G.J., Elangovan B., Houghton A.B., Malstrom S., Avery B.J., Ebb R.G., Subramanian T., Chittenden T., Lutz R.J., et al. . 1995. Bik, a novel death-inducing protein shares a distinct sequence motif with Bcl-2 family proteins and interacts with viral and cellular survival-promoting proteins. Oncogene. 11:1921–1928. - PubMed
    1. Cazanave S.C., Elmi N.A., Akazawa Y., Bronk S.F., Mott J.L., and Gores G.J.. 2010. CHOP and AP-1 cooperatively mediate PUMA expression during lipoapoptosis. Am. J. Physiol. Gastrointest. Liver Physiol. 299:G236–G243. 10.1152/ajpgi.00091.2010 - DOI - PMC - PubMed

Publication types

MeSH terms