. 2019 Sep 2;218(9):3098-3116.
doi: 10.1083/jcb.201903124. Epub 2019 Aug 6.

α-Integrins dictate distinct modes of type IV collagen recruitment to basement membranes

Affiliations

α-Integrins dictate distinct modes of type IV collagen recruitment to basement membranes

Ranjay Jayadev et al. J Cell Biol. .

Abstract

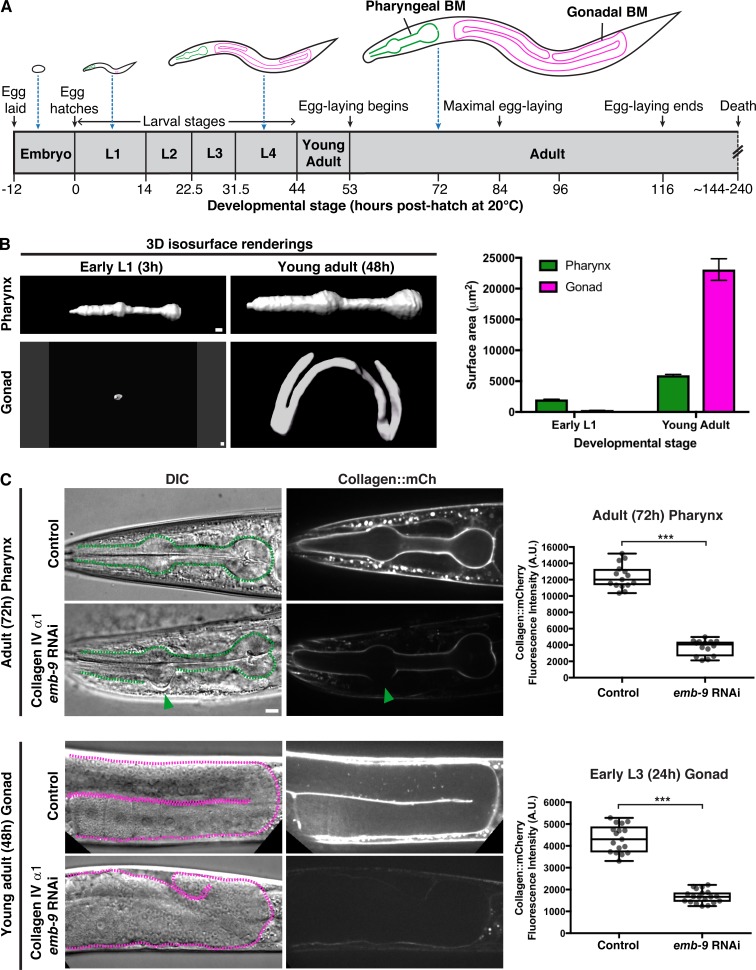
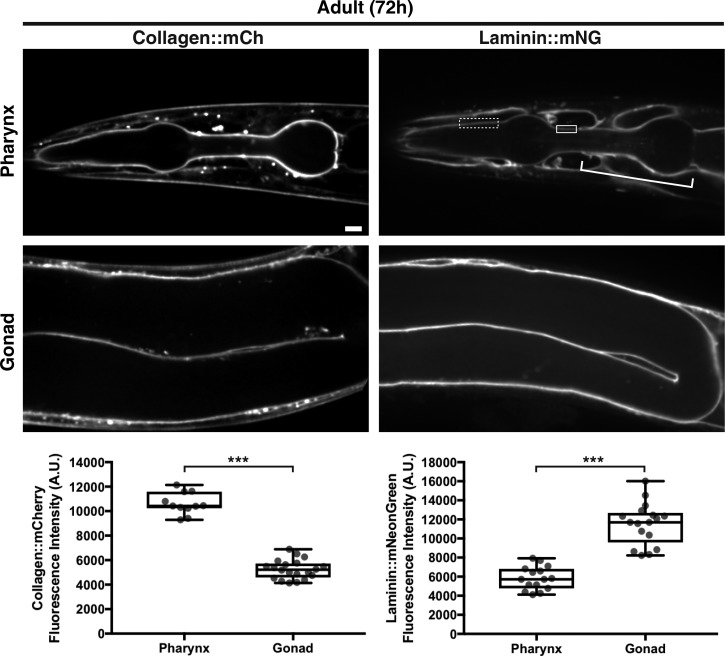
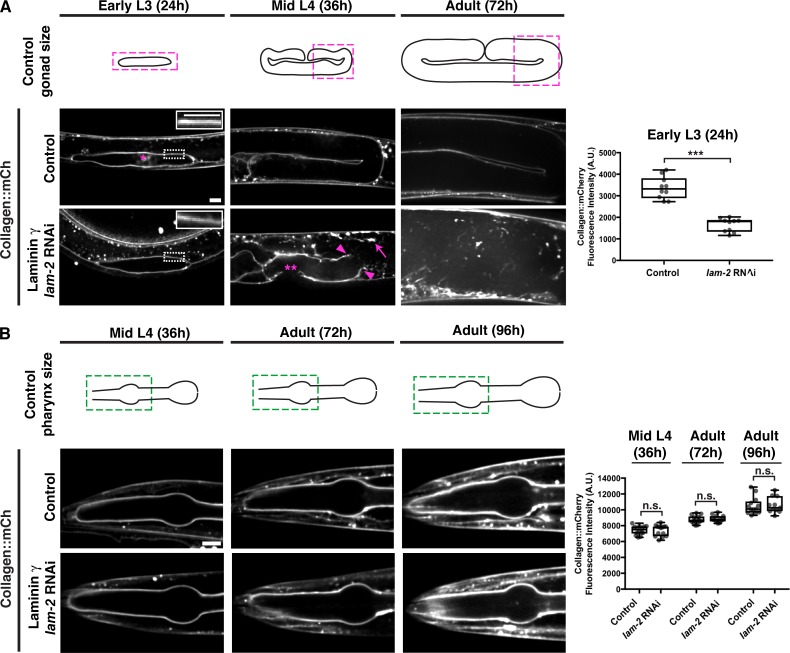
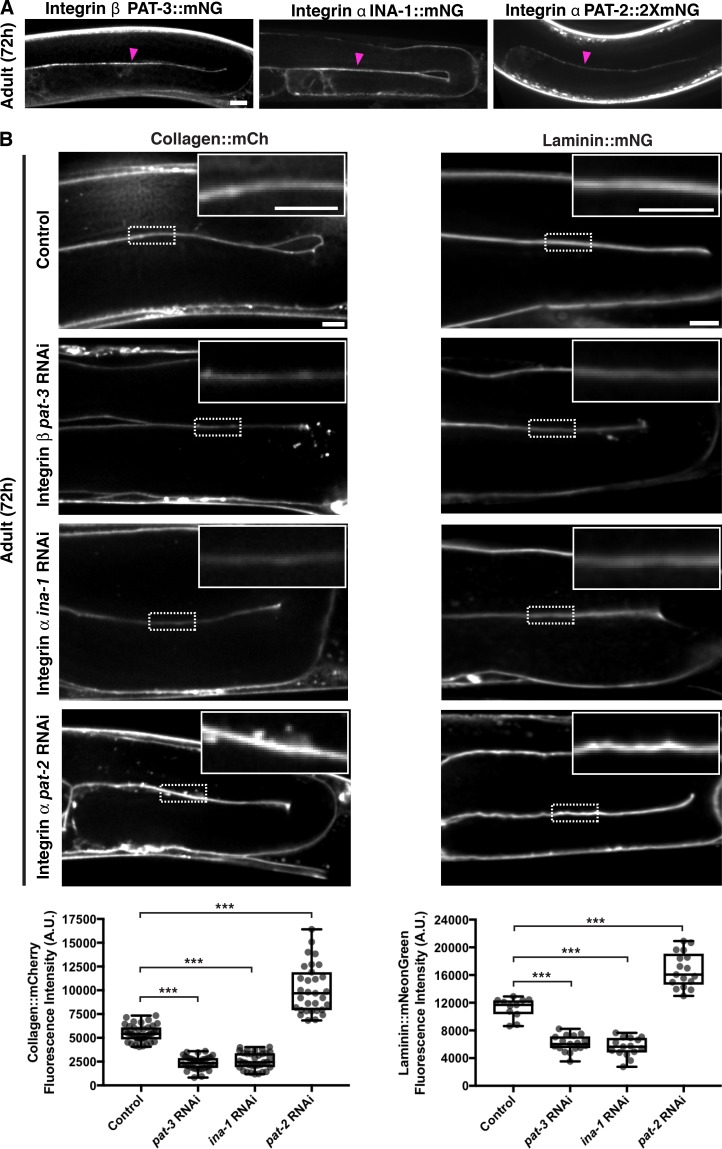
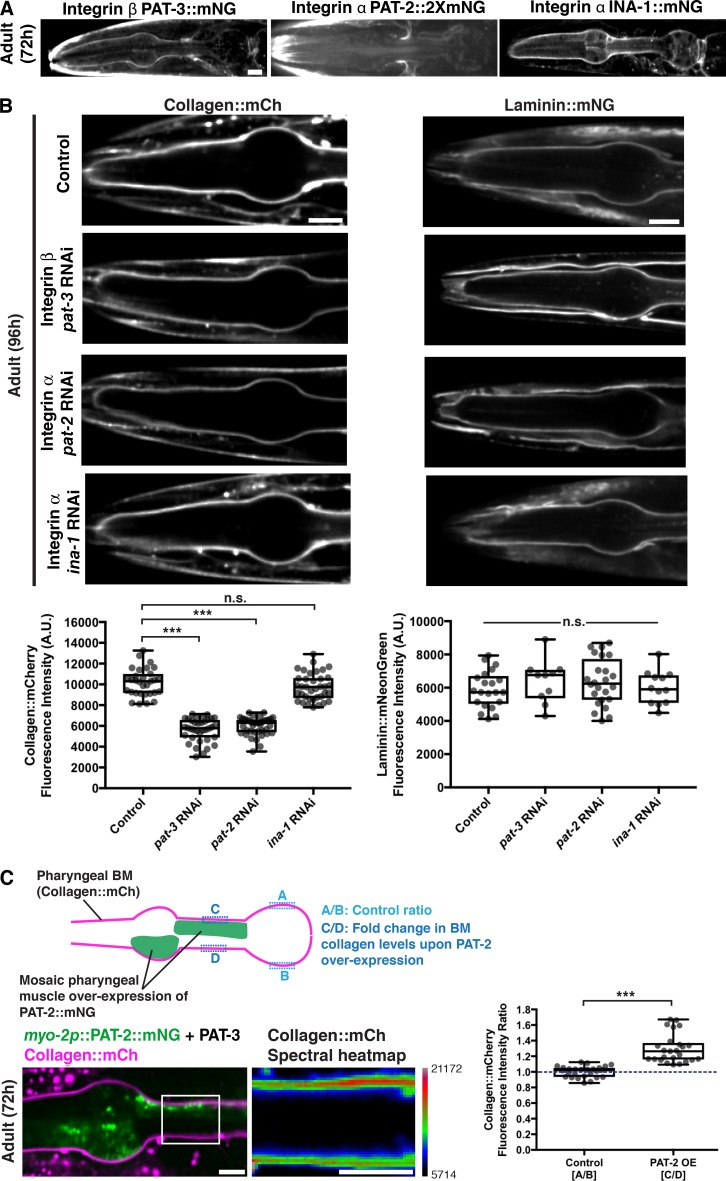
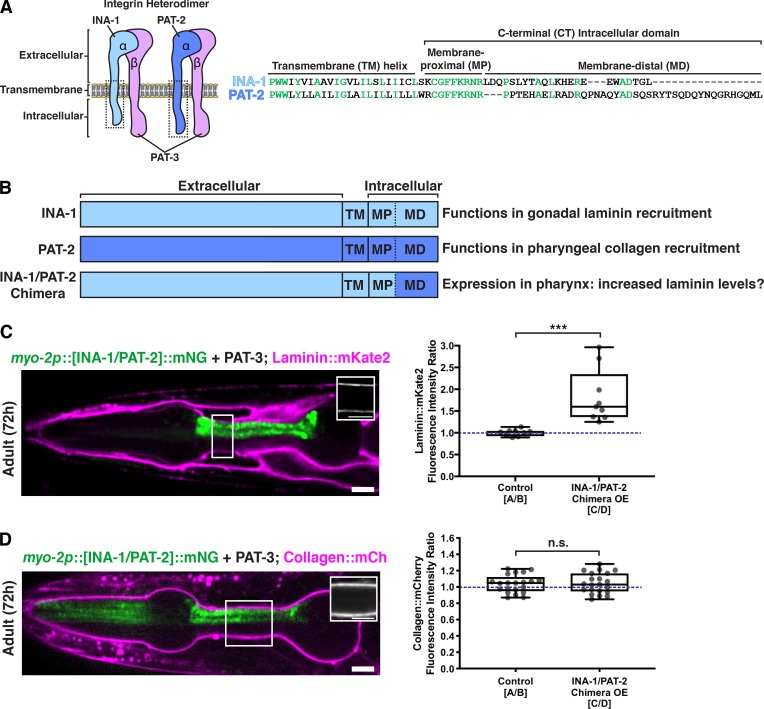
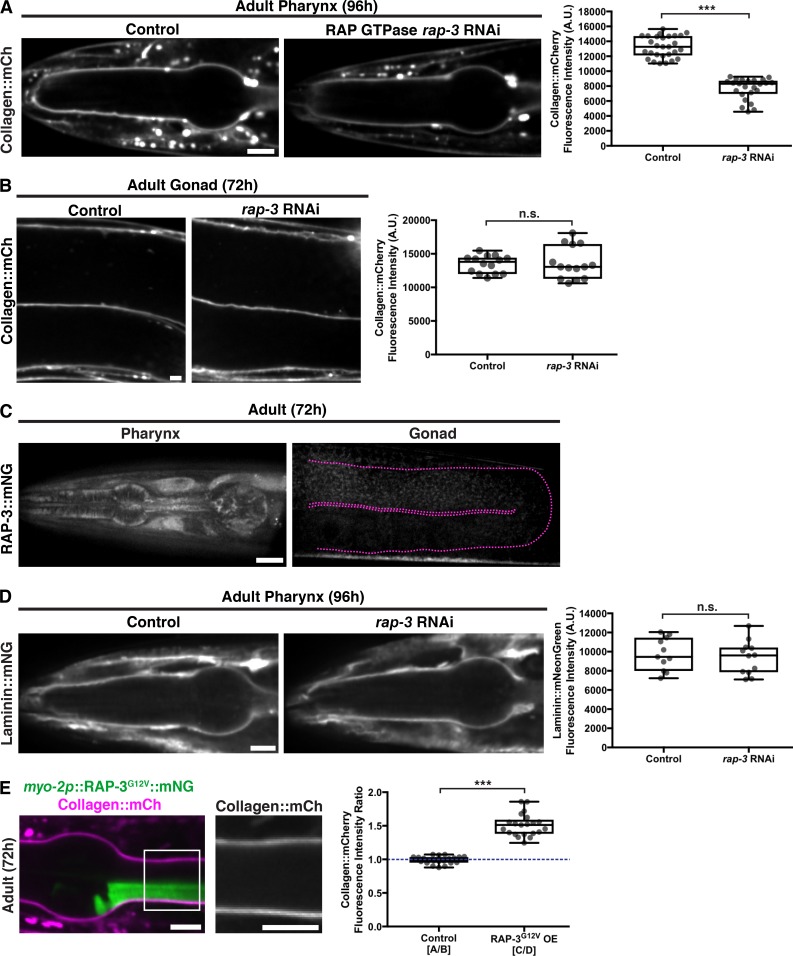
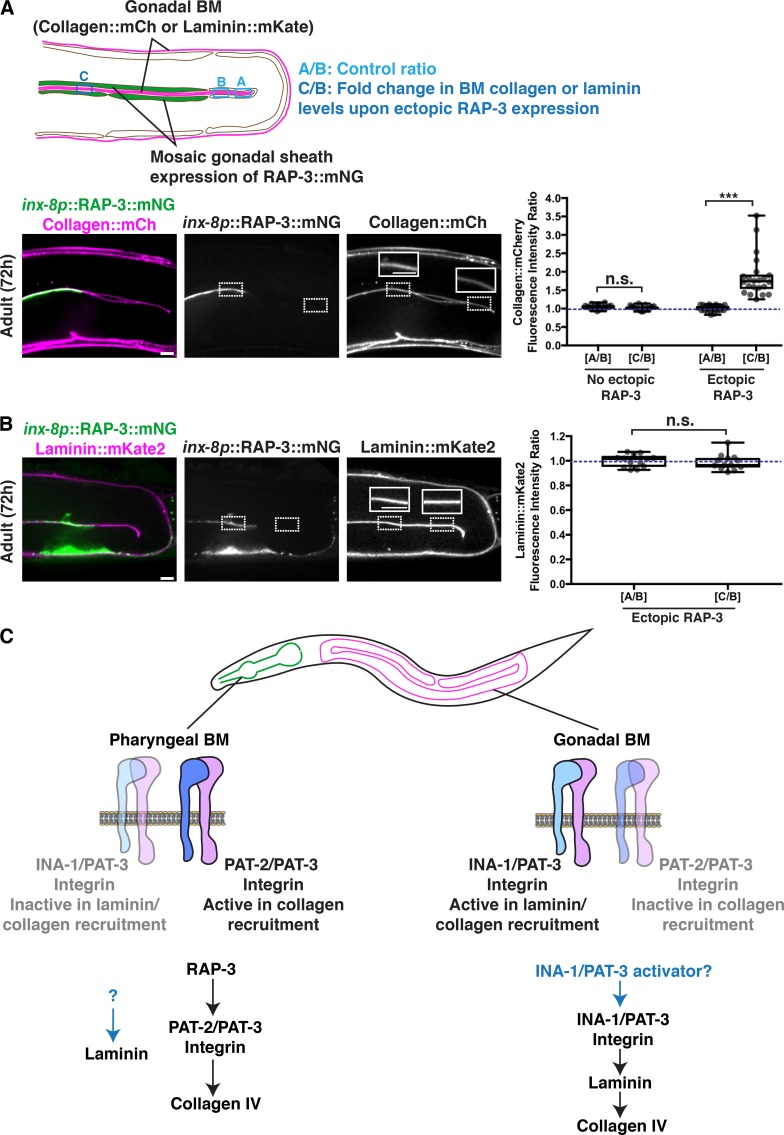
Basement membranes (BMs) are cell-associated extracellular matrices that support tissue integrity, signaling, and barrier properties. Type IV collagen is critical for BM function, yet how it is directed into BMs in vivo is unclear. Through live-cell imaging of endogenous localization, conditional knockdown, and misexpression experiments, we uncovered distinct mechanisms of integrin-mediated collagen recruitment to Caenorhabditis elegans postembryonic gonadal and pharyngeal BMs. The putative laminin-binding αINA-1/βPAT-3 integrin was selectively activated in the gonad and recruited laminin, which directed moderate collagen incorporation. In contrast, the putative Arg-Gly-Asp (RGD)-binding αPAT-2/βPAT-3 integrin was activated in the pharynx and recruited high levels of collagen in an apparently laminin-independent manner. Through an RNAi screen, we further identified the small GTPase RAP-3 (Rap1) as a pharyngeal-specific PAT-2/PAT-3 activator that modulates collagen levels. Together, these studies demonstrate that tissues can use distinct mechanisms to direct collagen incorporation into BMs to precisely control collagen levels and construct diverse BMs.


Figures

Figure 1.
Figure 1.
BM type IV collagen supports the growing C. elegans pharynx and gonad. (A) Illustrations of C. elegans at various stages of development (scaled to the length of the egg), with the pharyngeal and gonadal BMs outlined in green and magenta, respectively. (B) 3D isosurface renderings of pharyngeal and gonadal type IV collagen::mCh at the early L1 versus young adult stages on the left, and quantification of surface area on the right. Bar graphs show mean surface area, and error bars represent standard error of the mean (n = 10 all stages). (C) DIC and collagen::mCh fluorescence images of 72-h adult pharynxes (top left) and 48-h young adult gonads (bottom left) of control (L4440 empty vector) and collagen IV α1 (emb-9) RNAi-treated animals. Pharynxes in DIC images (top left) are outlined with green dotted lines. The green arrowhead indicates a deformation in the anterior pharyngeal bulb, corresponding to a region with undetectable collagen::mCh signal. Mean pharyngeal BM collagen::mCh fluorescence intensity in control (n = 15) and emb-9 RNAi-treated (n = 14) 72-h adult animals are quantified on the top right. Dotted magenta lines outline gonads in DIC images (bottom left). The gonads of emb-9 RNAi-treated animals are severely misshapen, correlating with near-undetectable BM collagen::mCh signal. Mean gonadal BM collagen::mCh fluorescence intensity in control (n = 17) and emb-9 RNAi-treated (n = 19) early L3 animals are quantified on the bottom right. ***, P < 0.0001, unpaired two-tailed Student’s t test. Box edges in boxplots depict the 25th and 75th percentiles, the line in the box indicates the median value, and whiskers mark the minimum and maximum values. Scale bars, 10 µm. A.U., arbitrary units.
Figure 2.
Figure 2.
The pharyngeal BM is collagen rich, while the gonadal BM is laminin rich. Fluorescence images of collagen::mCh and laminin::mNG in the pharynx and gonad of 72-h adult animals. As laminin::mNG localizes strongly to the nerve ring BM that surrounds and contacts the pharyngeal BM at several regions (bracket), we confined our measurements of laminin signal to the dotted box where clear pharyngeal BM laminin is visible in this and all relevant figures, except Fig. 6 C, where laminin signal in the solid box was also measured. Quantification of collagen::mCh and laminin::mNG levels in the pharyngeal (collagen::mCh, n = 11; laminin::mNG, n = 15) and gonadal BMs (collagen::mCh, n = 20; laminin::mNG, n = 17) are shown in boxplots at the bottom. ***, P < 0.0001, unpaired two-tailed Student’s t test. Box edges in boxplots depict the 25th and 75th percentiles, the line in the box indicates the median value, and whiskers mark the minimum and maximum values. Scale bar, 10 µm. A.U., arbitrary units.
Figure 3.
Figure 3.
Collagen recruitment to the gonadal but not pharyngeal BM is dependent on laminin. (A) Fluorescence images of gonadal BM collagen::mCh shown at the early L3, mid-L4, and 72-h adult stages in control and laminin γ (lam-2) RNAi-treated animals (RNAi fed at the L1 stage onwards). Control gonad size at these stages are shown in schematics, and the magenta boxes denote regions of the gonad shown in the figure. Collagen::mCh signal in the dotted box regions are magnified in insets. The asterisk indicates non-BM collagen::mCh signal from coelomocytes. Gonadal BM collagen::mCh fluorescence intensity in control (n = 10) and lam-2 (n = 10) RNAi-treated early L3 animals is quantified on the right. By the mid-L4 stage, rupturing of the gonadal BM (magenta arrowheads) and abnormal collagen aggregation (magenta arrow) was observed in lam-2 RNAi-treated animals (n = 20/20). The double asterisks mark a break in the BM due to anchor cell invasion, a normal morphogenetic event during C. elegans vulval development. (B) Fluorescence images of pharyngeal BM collagen::mCh in control and lam-2 RNAi-treated animals shown at the mid L4, 72-h adult, and 96-h adult stages. Control pharynx size at these stages are shown in schematics, and the green boxes denote regions of the pharynx shown in the figure. Pharyngeal BM collagen::mCh fluorescence intensity in control and lam-2 RNAi-treated animals at all three stages are quantified on the right (mid L4 control, n = 14; lam-2 RNAi, n = 14; 72-h adult control, n = 14; lam-2 RNAi, n = 12; 96-h adult control, n = 13; lam-2 RNAi, n = 11). ***, P < 0.0001, unpaired two-tailed Student’s t test; n.s. (not significant), P > 0.05. Box edges in boxplots depict the 25th and 75th percentiles, the line in the box indicates the median value, and whiskers mark the minimum and maximum values. Scale bars, 10 µm. A.U., arbitrary units.
Figure 4.
Figure 4.
The INA-1/PAT-3 integrin heterodimer is required for laminin-dependent collagen recruitment to the gonadal BM. (A) Fluorescence images of the integrin β subunit PAT-3::mNG and the integrin α subunits INA-1::mNG and PAT-2::2xmNG in the gonad. Magenta arrowheads indicate enrichment of fluorescence signal at the cell–BM interface. (B) Fluorescence images of gonadal BM collagen::mCh (left) and laminin::mNG (right) in control versus pat-3, ina-1, and pat-2 RNAi-treated 72-h adult animals. Regions of the BM in the dotted boxes are magnified in insets. Quantification of collagen::mCh (control, n = 38; pat-3 RNAi, n = 34; ina-1 RNAi, n = 34; pat-2 RNAi, n = 31) and laminin::mNG (control, n = 11; pat-3 RNAi, n = 17; ina-1 RNAi, n = 15; pat-2 RNAi, n = 17) fluorescence intensity for all treatments is shown at the bottom. ***, P < 0.0001, one-way ANOVA followed by post hoc Dunnett’s test. Box edges in boxplots depict the 25th and 75th percentiles, the line in the box indicates the median value, and whiskers mark the minimum and maximum values. Scale bars, 10 µm. A.U., arbitrary units.
Figure 5.
Figure 5.
The PAT-2/PAT-3 integrin heterodimer is required for laminin-independent collagen recruitment to the pharyngeal BM. (A) Fluorescence images of the integrin β subunit PAT-3::mNG and the integrin α subunits PAT-2::2xmNG and INA-1::mNG in the pharynx. (B) Fluorescence images of pharyngeal BM collagen::mCh (left) and laminin::mNG (right) in control versus pat-3, pat-2, and ina-1 RNAi-treated 96-h adult animals. Quantification of collagen::mCh (control, n = 31; pat-3 RNAi, n = 36; pat-2 RNAi, n = 39; ina-1 RNAi, n = 37) and laminin::mNG (control, n = 21; pat-3 RNAi, n = 10; pat-2 RNAi, n = 24; ina-1 RNAi, n = 12) fluorescence intensity for all treatments is shown at the bottom. Bottom left: ***, P < 0.0001, one-way ANOVA followed by post hoc Dunnett’s test; n.s. (not significant), P > 0.05. Bottom right: n.s. (not significant), P > 0.05, one-way ANOVA. (C) A schematic outlining mosaic overexpression of PAT-2::mNG in the pharyngeal muscle cells and method for quantification of collagen levels is shown on top. A merged fluorescence image of myo-2p::PAT-2::mNG (green) and collagen::mCh (magenta) in a 72-h adult pharynx is shown on the bottom left. A spectral heatmap of collagen::mCh fluorescence intensity in the boxed region is shown on the bottom right. Quantification of the fold change in pharyngeal BM collagen::mCh fluorescence intensity upon PAT-2 overexpression is shown on the right (n = 25). ***, P < 0.0001, paired two-tailed Student’s t test. Box edges in boxplots depict the 25th and 75th percentiles, the line in the box indicates the median value, and whiskers mark the minimum and maximum values. Scale bars, 10 µm. A.U., arbitrary units.
Figure 6.
Figure 6.
The intracellular domain of PAT-2 controls the activity of PAT-2/PAT-3 in the pharynx to promote collagen recruitment independent of laminin. (A) A schematic of the two integrin heterodimers expressed in the worm, highlighting the extracellular, transmembrane, and C-terminal intracellular regions of these proteins. Amino acid alignments of the boxed transmembrane and intracellular regions of INA-1 and PAT-2 are shown on the right. Highly conserved residues are shown in green. (B) Schematic of chimeric integrin α subunit. Determined functions of INA-1 and PAT-2 and the predicted outcome of INA-1/PAT-2 chimeric integrin expression in the pharynx are listed. (C) A merged fluorescence image of myo-2p::[INA-1/PAT-2]::mNG (green) and laminin::mKate2 (magenta) in a 72-h adult pharynx is shown. Laminin::mKate2 signal in the boxed region is magnified in the inset. Quantification of the fold change in pharyngeal BM laminin::mKate2 fluorescence intensity upon overexpression of the INA-1/PAT-2 chimera is shown on the right (n = 9). ***, P < 0.0001, paired two-tailed Student’s t test. (D) A merged fluorescence image of myo-2p::[INA-1/PAT-2]::mNG (green) and collagen::mCh (magenta) in a 72-h adult pharynx is shown. Collagen::mCh signal in the boxed region is magnified in the inset. Quantification of the fold change in pharyngeal BM collagen::mCh fluorescence intensity upon overexpression of the INA-1/PAT-2 chimera is shown on the right (n = 21). n.s. (not significant), P > 0.05, paired two-tailed Student’s t test. Box edges in boxplots depict the 25th and 75th percentiles, the line in the box indicates the median value, and whiskers mark the minimum and maximum values. Scale bars, 10 µm.
Figure 7.
Figure 7.
RAP-3 regulates the PAT-2/PAT-3-driven recruitment of collagen into the pharyngeal BM. (A) Fluorescence images of pharyngeal BM collagen::mCh in control and rap-3 RNAi-treated 96-h adult animals, with quantification of collagen::mCh fluorescence intensity on the right (control, n = 28; rap-3 RNAi, n = 24). (B) Fluorescence images of gonadal BM collagen::mCh in control and rap-3 RNAi-treated 72-h adult animals, with quantification of collagen::mCh fluorescence intensity on the right (control, n = 14; rap-3 RNAi, n = 14). (C) Fluorescence images of RAP-3::mNG localization in the pharynx and its absence in the gonad (outlined in magenta). (D) Fluorescence images of pharyngeal BM laminin::mNG in control and rap-3 RNAi-treated 96-h adult animals, with quantification of laminin::mNG fluorescence intensity on the right (control, n = 11; rap-3 RNAi, n = 12). ***, P < 0.0001, unpaired two-tailed Student’s t test; n.s. (not significant), P > 0.05. (E) Merged fluorescence image of myo-2p::RAP-3G12V::mNG (green) and collagen::mCh (magenta) in a 72-h adult pharynx. Pharyngeal BM collagen::mCh signal in the boxed region is magnified on the right. Quantification of fold increase in collagen::mCh fluorescence intensity upon RAP-3G12V overexpression is shown on the right (n = 21). ***, P < 0.0001, paired two-tailed Student’s t test. Box edges in boxplots depict the 25th and 75th percentiles, the line in the box indicates the median value, and whiskers mark the minimum and maximum values. Scale bars, 10 µm. A.U., arbitrary units.
Figure 8.
Figure 8.
Ectopic gonadal expression of RAP-3 increases BM collagen but not laminin levels. (A) A schematic outlining mosaic expression of RAP-3::mNG in the gonadal sheath cells and method for quantification of collagen and laminin levels is shown on top. A merged fluorescence image of inx-8p::RAP-3::mNG (green) and collagen::mCh (magenta) in a 72-h adult gonad is shown on the bottom left, and split RAP-3::mNG and collagen::mCh channel images are shown on the bottom right. The dotted box on the left indicates a region of RAP-3 expression, and the dotted box on the right denotes absence of RAP-3 expression. Collagen::mCh signal in the dotted box regions are magnified in insets. Quantification of fold increase in gonadal BM collagen::mCh fluorescence intensity upon ectopic RAP-3 expression is shown on the right (n = 22). (B) A merged fluorescence image of inx-8p::RAP-3::mNG (green) and laminin::mKate2 (magenta) in a 72-h adult gonad is shown on the left, and split RAP-3::mNG and laminin::mKate2 channel images on the right. The dotted box on the left indicates a region of RAP-3 expression, and the dotted box on the right denotes absence of RAP-3 expression. Laminin::mKate2 signal in the dotted box regions are magnified in insets. Quantification of fold increase in gonadal BM laminin::mKate2 fluorescence intensity upon ectopic RAP-3 expression is shown on the right (n = 13). ***, P < 0.0001, paired two-tailed Student’s t test; n.s. (not significant), P > 0.05. (C) Model for distinct modes of collagen recruitment to the pharyngeal and gonadal BMs. Box edges in boxplots depict the 25th and 75th percentiles, the line in the box indicates the median value, and whiskers mark the minimum and maximum values. Scale bars, 10 µm.

References

    1. Babonis L.S., and Martindale M.Q.. 2017. Phylogenetic evidence for the modular evolution of metazoan signalling pathways. Philos. Trans. R. Soc. Lond. B Biol. Sci. 372:20150477 10.1098/rstb.2015.0477 - DOI - PMC - PubMed
    1. Bai M., Vozdek R., Hnízda A., Jiang C., Wang B., Kuchar L., Li T., Zhang Y., Wood C., Feng L., et al. . 2018. Conserved roles of C. elegans and human MANFs in sulfatide binding and cytoprotection. Nat. Commun. 9:897 10.1038/s41467-018-03355-0 - DOI - PMC - PubMed
    1. Boettner B., and Van Aelst L.. 2009. Control of cell adhesion dynamics by Rap1 signaling. Curr. Opin. Cell Biol. 21:684–693. 10.1016/j.ceb.2009.06.004 - DOI - PMC - PubMed
    1. Bouvard D., Pouwels J., De Franceschi N., and Ivaska J.. 2013. Integrin inactivators: balancing cellular functions in vitro and in vivo. Nat. Rev. Mol. Cell Biol. 14:430–442. 10.1038/nrm3599 - DOI - PubMed
    1. Breitkreutz D., Koxholt I., Thiemann K., and Nischt R.. 2013. Skin basement membrane: the foundation of epidermal integrity--BM functions and diverse roles of bridging molecules nidogen and perlecan. BioMed Res. Int. 2013:179784 10.1155/2013/179784 - DOI - PMC - PubMed

Publication types

MeSH terms